Grafana: Incorrect color scale when using a heatmap with log-scale
What happened:
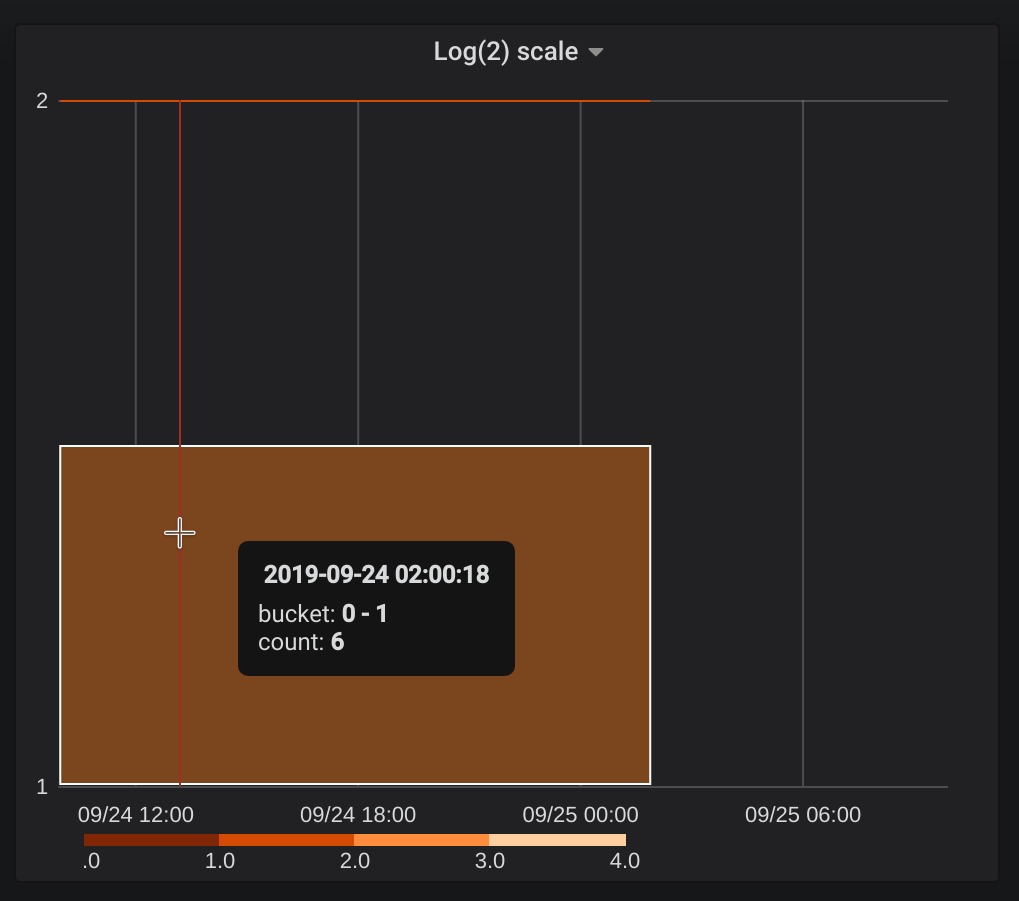
Grafana incorrectly assigns color to buckets when using a logarithmic scale. The legend indicates a maximum value of 4, although the bucket contains 6 values and has a color that represents a value of 2. This seems to be related to the way 0s are handled when using a log scale.
Also, this toggle does not seem to work

How to reproduce it (as minimally and precisely as possible):
Here is demo of the bug:
https://snapshot.raintank.io/dashboard/snapshot/YfSMnwgvL4lEU1rDGjK61oTrjznIpeQE
To reproduce the issue, consider the following dataset with 7 values : [2, 1, 1, 0, 0, 0, 0] (with the same timestamp)
The linear scale splits the data in 3 buckets as you would expect: 0 (4 values), 1 (2 values), 2 (1 value) and the legend goes from 0 to 4 (maximum).
The log scale splits the data in 2 buckets, one for 0s and 1s (6 values) and one for 2 (1 value). However the color seems to indicate a value of 2 for the first bucket instead of 6
-> The bucket with 0s and 1s contains 6 values, has a color that indicates 2, and a legend with a maximum value of 4
Possible explaination: It seems that under the hood, 0s are put into a special bucket (see here)
that is merged with the bucket with 1s when displayed. However, this special bucket is still taken into account for the computation of the color scale (that is why the maximum is 4) but only 1s are considered when computing the color of the bucket (2)
Environment:
- Grafana version: 3.6.5
- Data source type & version: TestData Db
- OS Grafana is installed on: Grafana cloud
- User OS & Browser: Ubuntu 18.10, Chrome
- Grafana plugins: -
 tomdug
All 3 comments
@tomdug Can you show me how you have configured grafana testdata query in your panel? Trying to reproduce this on current master, but don't get the same result as you.
 marefr
on 25 Sep 2019
marefr
on 25 Sep 2019


tomdug
on 25 Sep 2019
Confirmed bug on master (c60882b)
marefr
on 25 Sep 2019
Related issues
 Azef1
·
3Comments
Azef1
·
3Comments
 kcajf
·
3Comments
kcajf
·
3Comments
 SATHVIKRAJU
·
3Comments
SATHVIKRAJU
·
3Comments
 ericuldall
·
3Comments
ericuldall
·
3Comments
 deepujain
·
3Comments
deepujain
·
3Comments
Most helpful comment
Confirmed bug on master (c60882b)