Charts: Gráfico de linha preenchida
Estou tentando desenhar um gráfico de linhas preenchido, vocês podem ver a imagem para mais clareza.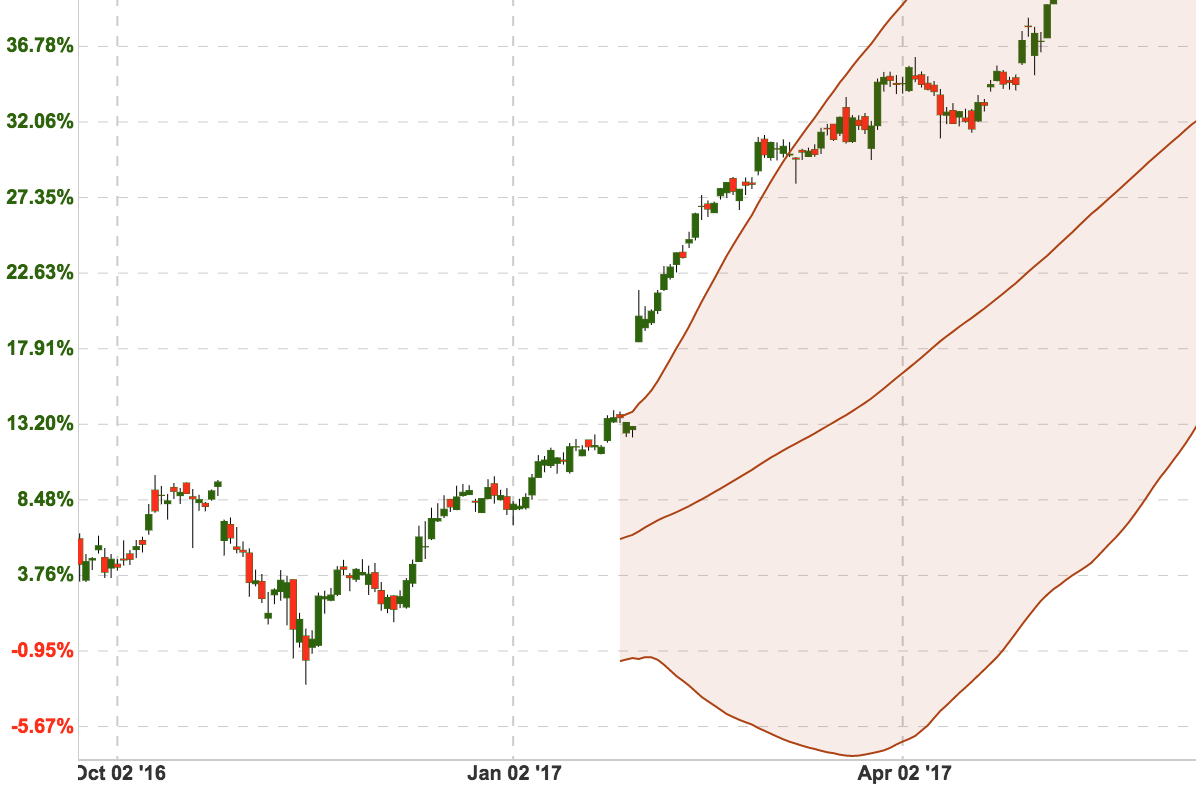
Então, eu vi o exemplo e eles estão usando o protocolo IFillFormatter para obter a posição do eixo y onde a linha preenchida do conjunto de dados termina. Mas era uma posição fixa, nada dinâmica. Como posso essa posição depender de cada elemento do conjunto de dados. Por exemplo, se índice == 0 então temos o final da posição preenchida A, se índice == 1 então temos um valor final diferente de uma posição preenchida.
Ou qualquer outra sugestão de desenhar um gráfico como a imagem acima.
 sunynator
Todos 17 comentários
dê uma olhada em drawLinearFill onde desenhou o retângulo de preenchimento. Ele calcula o retângulo de preenchimento entre generateFilledPath e getFillLinePosition . idealmente, você deve substituir esses métodos para obter o seu reto entre as linhas, você está pronto para ir
 liuxuan30
em 25 out. 2017
liuxuan30
em 25 out. 2017
Consegui fazer isso seguindo as sugestões de @ liuxuan30 subclassificando LineChartRenderer e adicionando uma variável à classe implementando IFillFormatter , que me permite passar um segundo conjunto de dados como indicador para a linha de preenchimento e desenhe o caminho de acordo (apenas para linear, mas presumo que você possa fazer a mesma coisa para Bezier).
class AreaFillFormatter: IFillFormatter {

    var fillLineDataSet: LineChartDataSet?

    init(fillLineDataSet: LineChartDataSet) {
        self.fillLineDataSet = fillLineDataSet
    }

    public func getFillLinePosition(dataSet: ILineChartDataSet, dataProvider: LineChartDataProvider) -> CGFloat {
        return 0.0
    }

    public func getFillLineDataSet() -> LineChartDataSet {
        return fillLineDataSet ?? LineChartDataSet()
    }

}
class CustomLineChartRenderer: LineChartRenderer {

    override open func drawLinearFill(context: CGContext, dataSet: ILineChartDataSet, trans: Transformer, bounds: XBounds) {
        guard let dataProvider = dataProvider else { return }

        let areaFillFormatter = dataSet.fillFormatter as? AreaFillFormatter

        let filled = generateFilledPath(
            dataSet: dataSet,
            fillMin: dataSet.fillFormatter?.getFillLinePosition(dataSet: dataSet, dataProvider: dataProvider) ?? 0.0,
            fillLineDataSet: areaFillFormatter?.getFillLineDataSet(),
            bounds: bounds,
            matrix: trans.valueToPixelMatrix)

        if dataSet.fill != nil
        {
            drawFilledPath(context: context, path: filled, fill: dataSet.fill!, fillAlpha: dataSet.fillAlpha)
        }
        else
        {
            drawFilledPath(context: context, path: filled, fillColor: dataSet.fillColor, fillAlpha: dataSet.fillAlpha)
        }
    }

    fileprivate func generateFilledPath(dataSet: ILineChartDataSet, fillMin: CGFloat, fillLineDataSet: ILineChartDataSet?, bounds: XBounds, matrix: CGAffineTransform) -> CGPath
    {
        let phaseY = animator?.phaseY ?? 1.0
        let isDrawSteppedEnabled = dataSet.mode == .stepped
        let matrix = matrix

        var e: ChartDataEntry!
        var fillLineE: ChartDataEntry?

        let filled = CGMutablePath()

        e = dataSet.entryForIndex(bounds.min)
        fillLineE = fillLineDataSet?.entryForIndex(bounds.min)

        if e != nil
        {
            if let fillLineE = fillLineE
            {
                filled.move(to: CGPoint(x: CGFloat(e.x), y: CGFloat(fillLineE.y * phaseY)), transform: matrix)
            }
            else
            {
                filled.move(to: CGPoint(x: CGFloat(e.x), y: fillMin), transform: matrix)
            }

            filled.addLine(to: CGPoint(x: CGFloat(e.x), y: CGFloat(e.y * phaseY)), transform: matrix)
        }

        // Create the path for the data set entries
        for x in stride(from: (bounds.min + 1), through: bounds.range + bounds.min, by: 1)
        {
            guard let e = dataSet.entryForIndex(x) else { continue }

            if isDrawSteppedEnabled
            {
                guard let ePrev = dataSet.entryForIndex(x-1) else { continue }
                filled.addLine(to: CGPoint(x: CGFloat(e.x), y: CGFloat(ePrev.y * phaseY)), transform: matrix)
            }

            filled.addLine(to: CGPoint(x: CGFloat(e.x), y: CGFloat(e.y * phaseY)), transform: matrix)
        }

        // Draw a path to the start of the fill line
        e = dataSet.entryForIndex(bounds.range + bounds.min)
        fillLineE = fillLineDataSet?.entryForIndex(bounds.range + bounds.min)
        if e != nil
        {
            if let fillLineE = fillLineE
            {
                filled.addLine(to: CGPoint(x: CGFloat(e.x), y: CGFloat(fillLineE.y * phaseY)), transform: matrix)
            }
            else
            {
                filled.addLine(to: CGPoint(x: CGFloat(e.x), y: fillMin), transform: matrix)
            }
        }

        // Draw the path for the fill line (backwards)
        if let fillLineDataSet = fillLineDataSet {
            for x in stride(from: (bounds.min + 1), through: bounds.range + bounds.min, by: 1).reversed()
            {
                guard let e = fillLineDataSet.entryForIndex(x) else { continue }

                if isDrawSteppedEnabled
                {
                    guard let ePrev = fillLineDataSet.entryForIndex(x-1) else { continue }
                    filled.addLine(to: CGPoint(x: CGFloat(e.x), y: CGFloat(ePrev.y * phaseY)), transform: matrix)
                }

                filled.addLine(to: CGPoint(x: CGFloat(e.x), y: CGFloat(e.y * phaseY)), transform: matrix)
            }
        }

        filled.closeSubpath()

        return filled
    }
}
 rob-k
em 15 nov. 2017
rob-k
em 15 nov. 2017
exemplo perfeito para dominar o projeto :)
liuxuan30
em 18 nov. 2017
como resolver / usar essa solução?
 jjy4880
em 5 dez. 2018
jjy4880
em 5 dez. 2018
@ rob-k você pode fornecer um exemplo de uso para este
 bhargavsejpalindianic
em 27 mai. 2019
bhargavsejpalindianic
em 27 mai. 2019
Claro, eu uso o código da seguinte maneira:
let maxDataSet = LineChartDataSet()
let minDataSet = LineChartDataSet()

// ... fill the data sets

// Set the data
self.lineChart.data = LineChartData(dataSets: [maxDataSet, minDataSet])

// Set the custom line chart renderer
self.lineChart.renderer = CustomLineChartRenderer(dataProvider: self.lineChart, animator: self.lineChart.chartAnimator, viewPortHandler: self.lineChart.viewPortHandler)

maxDataSet.drawFilledEnabled = true
maxDataSet.fillFormatter = AreaFillFormatter(fillLineDataSet: minDataSet)
Eu instalei isso manualmente e segui cada etapa conforme o exemplo ainda parece que não está funcionando @ rob-k
bhargavsejpalindianic
em 28 mai. 2019
@ rob-k eu tentei depurar usando pontos de interrupção qualquer função de CustomLineChartRenderer não sendo chamada
bhargavsejpalindianic
em 28 mai. 2019
Eu atualizei meu comentário para incluir a configuração de LineChartRenderer .
rob-k
em 28 mai. 2019
ainda sem sorte man @ rob-k
bhargavsejpalindianic
em 28 mai. 2019
Se você quiser a cor entre ucbDataSet e lcbDataSet você precisa passar o segundo conjunto de dados para o formatador do primeiro. Você está passando o conjunto de dados para o próprio formatador. Tente fazer o seguinte:
ucbDataSet.fillFormatter = AreaFillFormatter(fillLineDataSet: lcbDataSet)
(ou o contrário)
rob-k
em 28 mai. 2019
já tentei o que estou tentando explicar é
Eu tentei depurar usando pontos de interrupção, qualquer função da classe CustomLineChartRenderer não sendo chamada
bhargavsejpalindianic
em 28 mai. 2019
Vejo que você está usando o modo Bezier em seu código:
lineChartDataSet.mode = .horizontalBezier
ucbDataSet.mode = .horizontalBezier
lcbDataSet.mode = .horizontalBezier
O código que forneci funciona apenas para o modo linear. Você terá que alterar o modo para .linear ou substituir drawHorizontalBezier e ajustar o código de acordo.
rob-k
em 28 mai. 2019
@ rob-k acabou de funcionar, muito obrigado cara por descobrir
bhargavsejpalindianic
em 28 mai. 2019
Seria possível implementar isso usando CombinedChart?
 michal-th
em 13 out. 2019
michal-th
em 13 out. 2019
Seria possível implementar isso usando CombinedChart?
Você encontrou a solução ? o CombinedChart usa o CombinedChartRender, não o LinearChartRender, então o retorno de chamada não é chamado de drawLinearFill , ele usa o Render padrão
o método drawLinearFill não existe, são necessários muitos novos renderizadores quando você pesquisa na biblioteca
 Chakib-Temal
em 13 dez. 2019
Chakib-Temal
em 13 dez. 2019
Seria possível implementar isso usando CombinedChart?
solução mixedChart: https://github.com/PhilJay/MPAndroidChart/issues/338
Chakib-Temal
em 14 dez. 2019
Questões relacionadas
 sjdevlin
·
3Comentários
sjdevlin
·
3Comentários
 guanyanlin
·
3Comentários
guanyanlin
·
3Comentários
 PrashantKT
·
3Comentários
PrashantKT
·
3Comentários
 BrandonShega
·
4Comentários
BrandonShega
·
4Comentários
 newbiebie
·
3Comentários
newbiebie
·
3Comentários
Comentários muito úteis
Consegui fazer isso seguindo as sugestões de @ liuxuan30 subclassificando
LineChartRenderere adicionando uma variável à classe implementandoIFillFormatter, que me permite passar um segundo conjunto de dados como indicador para a linha de preenchimento e desenhe o caminho de acordo (apenas para linear, mas presumo que você possa fazer a mesma coisa para Bezier).