Grafana: Alerting: Time of day restrictions
Time of day restrictions.
See two ways this could be implemented.
1) As an alert condition
2) As a filter on notifications
 torkelo
All 83 comments
Has anyone come up with a workaround for this scenario? I'm shocked that only 4 people have upvoted this ticket as the entire alerting feature is essentially rendered useless for me unless my systems are up 24/7. I feel like I must be missing some other feature or technique that everyone else is doing to circumvent this problem...
As it stands now, I either have to turn all alerting notifications off , or just accept the fact that I will get a bunch of spurious notifications when my processes shutdown EOD.
Not trying to sound critical really, just confused how everyone else is managing these alerts. I've loved Grafana for years now, and I've been tracking the alerting feature since it was first introduced in v4. But it's a bit of a head-scratcher every time there's an alerting update and this limitation isn't addressed.
 bblazei
on 10 Apr 2017
bblazei
on 10 Apr 2017
@bblazei you're right! it's a amazing feature which need to be priorised and for sure which will be helpful ppl for sure !
@torkelo do you know when this feature will be planned ?
 JulienChampseix
on 11 Apr 2017
JulienChampseix
on 11 Apr 2017
No not Eta right now as it's not on our roadmap for the next two releases (4.3 and 4.4)
torkelo
on 11 Apr 2017
Hmm well that's unfortunate. How would you recommend using the Alerting framework on systems that are not 24/7?
bblazei
on 5 May 2017
This is something that we would very much like as we need to have different alert levels depending on the time of day
 joelraburton
on 4 Jul 2017
joelraburton
on 4 Jul 2017
We are (not so) patiently waiting for this too. We currently utilize curl to Slack graphs periodically.
 cjs226span
on 10 Jul 2017
cjs226span
on 10 Jul 2017
@torkelo torkelo. its been a while i dont see an update on this. we are also looking to some thing like if we can disable the grafana alerts for specific time. is that possible?
 rajpaly
on 14 Aug 2017
rajpaly
on 14 Aug 2017
Has anybody some update for this feature?
 yacut
on 9 Nov 2017
yacut
on 9 Nov 2017
I'm able to manually pause alerts on the Alert List page, but (for example) during our daily 2:30a DB server backup we get an alert on "Network I/O Waits In Progress." It would certainly be nice to create alerts that it do not notify during certain periods of time.
 stevebanik-ndsc
on 16 Nov 2017
stevebanik-ndsc
on 16 Nov 2017
Does grafana support a modulo operation? Then, you should be able to use the identity function to get the unix time as an additional metric in your panel. With the modulo function you could get the remainder of the division of the unix time by 86400 (the number of seconds in a day). Then you could add a range condition on the time metric in your alert. Right?
Would it be difficult to add the modulo operation for this purpose?
 fsobanski
on 4 Dec 2017
fsobanski
on 4 Dec 2017
Really need this feature!
 solosky
on 9 Jan 2018
solosky
on 9 Jan 2018
Any updates on this? Is it a WIP or something still just being 'considered' right now?
 cherryghost
on 22 Feb 2018
cherryghost
on 22 Feb 2018
We really would like to use different timeframes for certain alerts like usage, which we expect to be above a certain threshold during the day but not at night.
 jsimpsoncd
on 1 Mar 2018
jsimpsoncd
on 1 Mar 2018
+1
 pete-leese
on 3 Mar 2018
pete-leese
on 3 Mar 2018
+1
 lilaboc
on 19 Mar 2018
lilaboc
on 19 Mar 2018
+1
 julienlefur
on 27 Mar 2018
julienlefur
on 27 Mar 2018
Why are people (@bascarsija & @maizy) down-voting people's requests for this?
 matt-conrad-ck
on 27 Mar 2018
matt-conrad-ck
on 27 Mar 2018
people are "down-voting" these "+1" messages that cause email notifications to be sent to everyone who is subscribed to this thread. the cumulative effect of many people adding these "+1" messages to the threads significantly reduces the value of the thread subscription feature by dramatically reducing the signal-to-noise ratio.
you can indicate your interest in or agreement with specific proposals or comments made by others without triggering any such email notifications by simply "up-voting" or "down-voting" via the reactions. the most prominent display of solidarity/aggregate interest in an issue is typically the reaction counts on the initial/primary description of the issue -- please consider adding your reactions there.
frankly, this is a systemic problem with Github -- it applies equally to all issue threads in all projects. you will find many pleas across the various threads requesting such usage because the Github UI does not inform users of this consequence or discourage it in obvious any way, and users who are aware of the problem (and/or are negatively impacted by it) are likely hesitant to provide such feedback by adding yet another message to the thread (thereby decreasing the signal-to-noise ratio further).
 bascarsija
on 27 Mar 2018
bascarsija
on 27 Mar 2018
Thanks for the explanation. I'm guessing the people posting those +1s wouldn't have done it if they knew it was just an annoyance. Posting a short explanation about that might have stopped a few of those... as well as my question. Thumbs-down could mean a number of things.
matt-conrad-ck
on 28 Mar 2018
Any update on schedule alert(s) during the certain time of the day, week, month and year?
 nkshah
on 28 Mar 2018
nkshah
on 28 Mar 2018
As a workaround, using prometheus as backend:
- Add the following query to your metric:
hour(), that returns the hour of the day (0-23). You can make it hidden in the graph. - Add an extra
ANDcondition to your alert, so it's only alerting if thehour()query is between the range you want (eg: office hours).
The same can be done with day_of_week().
 albertvaka
on 15 May 2018
albertvaka
on 15 May 2018
We also need this feature if we want to be able to offer 24H service based on different teams in the world... is there any plan for this?
 cc250080
on 25 Jun 2018
cc250080
on 25 Jun 2018
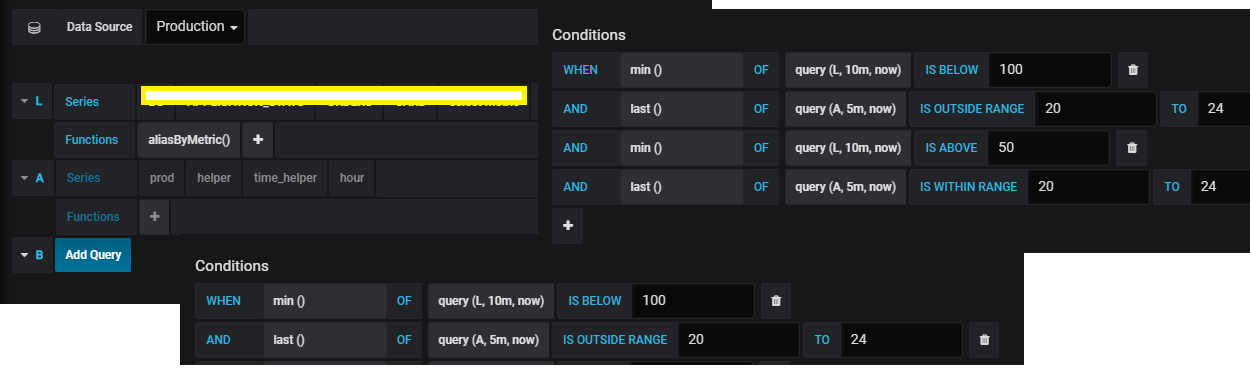
Meantime this feature is getting ready, i am trying to use workaround.
Example:
```
metric A : production.application_a.actual_metric = 123 (This is my actual metric)
metric B : helper.time_helper.hour = 1 to 24 ( Fake time metrics that is sent hour of the day every minute to graphite)
alert requirement :
(metric A is below 100 AND hour is inside range 10 and 20)
OR
(metric A is below 50 AND hour is outside range 10 and 20)
```
in other words:
metric A threshold is 100 between 10AM to 8PM and it is 50 for rest of the time
My question :
For the above scenario, can i achieve with single graph panel or do i really two different graph panel one each for inside range and outside range? Or is there any other way in grafana to achieve this? (Note: I am using graphite 0.9.)
 yesoreyeram
on 12 Jul 2018
yesoreyeram
on 12 Jul 2018
Also waiting for this feature, interesting approach to send some false metrics to grafana... just wondering what a nice, simple option would be to generate the metrics?
 unridaz
on 13 Jul 2018
unridaz
on 13 Jul 2018
+1 can we just have an arbitrary query that we can use expressions to limit the alert condition?
hour between 1 and 2 AND
 justinhilles
on 29 Jul 2018
justinhilles
on 29 Jul 2018
+1 would be so appreciated!
 gsemet
on 27 Aug 2018
gsemet
on 27 Aug 2018
Just a comment on a crude work around
I use collectd / Influxdb
I have a cron process that writes the hour value to a flat ext file
The collect Table plugin reads this as a Table_Value - Instance "Hour"
In any alert where I need to use only a range I add the metric hour (max) to the dashboard as a hidden metric, then in the alert use an AND range value - only trigger if hour is between X and Y
Same thing works on day of week as well
Crude but effective
 JasonHeb
on 28 Sep 2018
JasonHeb
on 28 Sep 2018
@torkelo any guestimate on when this might be implemented?
 discoduck2x
on 4 Nov 2018
discoduck2x
on 4 Nov 2018
No, sorry, it’s not on the core team roadmap
torkelo
on 4 Nov 2018
any work around to prevent alerts being sent when an Cloud vm instance is scheduled being off due to be scheduled off. most systems have this for many years.
please add this ;) alert fatigue setting.
 freibuis
on 16 Nov 2018
freibuis
on 16 Nov 2018
I have a cron process that writes the hour value to a flat ext file
In any alert where I need to use only a range I add the metric hour (max) to the dashboard as a hidden metric, then in the alert use an AND range value - only trigger if hour is between X and Y
This is quite an effective workaround with a subtle but useful advantage over just ignoring alerts between X - Y: If the situation isn't rectified before Y, I get my first alert at Y. If I just ignored alerts between X - Y, I wouldn't be alerted even after Y (although one could use the "Send reminders" feature I guess).
It turned out a cron job wasn't necessary when using graphite as the data source:
I added a metric C of timeSlice(isNonNull(identity(1)), '02:30 -9h', '06:00 -9h') and added the alert condition AND max() OF query(C, 1m, now) HAS NO VALUE to exclude alerts between 2:30 - 6:00. (That -9h is because my timezone offset is +9:00 and timeSlice() appears to be in UTC.)
EDIT: After few days trying this out, that timeSlice() trick doesn't seem to be working... It appears to be stuck to time I saved the dashboard and doesn't move to each day.
 atnak
on 29 Nov 2018
atnak
on 29 Nov 2018
This is a huge missing feature. Why is this not on the roadmap? Seems trivial to implement
 DDSloan96
on 22 Jan 2019
DDSloan96
on 22 Jan 2019
Really thanks to @albertvaka for his workaround using the hour() function of Prometheus.
Unfortunately, seens like there's no way to automatically consider the timezone when using the hour() function (and it's a problem when there's DST). We could only calculate the timezone manually based on the month and day, but it isn't a good solution.
More info on prometheus/prometheus#4160
 rodrigoroma
on 12 Feb 2019
rodrigoroma
on 12 Feb 2019
would be nice to be able to set different threshold levels for different datetime periods
e.g. it's ok if there is almost no user acitivity events at night, but not ok during the day
 alekseyl1992
on 5 Mar 2019
alekseyl1992
on 5 Mar 2019
Is there any progress on this request?
 erikoffereins
on 16 Apr 2019
erikoffereins
on 16 Apr 2019
Not sure, but I couldn't find anything new related to this in Grafana 6.1.3
rodrigoroma
on 17 Apr 2019
Would love to see this feature implemented. We use Grafana for business critical alerts it would be great to not notify people in the company when it is not required for example in their free time.
 perplexityjeff
on 29 Apr 2019
perplexityjeff
on 29 Apr 2019
+1, would love for this to be implemented.
 griffincox
on 15 May 2019
griffincox
on 15 May 2019
+1 god forbid i forget to pause monitoring before i go home for the weekend, ill come back on Monday to thousands of emails for expected behaviour
 henrydan
on 24 May 2019
henrydan
on 24 May 2019
+1 please implement this ASAP - i am going to have to port everything to thingsboard if this doesnt get implemented soon https://thingsboard.io/
 kwran420
on 27 May 2019
kwran420
on 27 May 2019
@torkelo could you give us some information about this issue? Is there any progress?
erikoffereins
on 29 May 2019
Hi, is there someone with enough knowledge to implement it and make a pull request ?
 Atem18
on 31 May 2019
Atem18
on 31 May 2019
I can tell you what I did to "get" this feature. I cannot share the code as it is proprietary, but I can share an idea, which is not a subject to any proprietary bull** whatsoever.
I've implemented couple of cron-scheduled [SomeCloudProviderOfYourChoice]Lambda functions that used Grafana REST API to update whole dashboards from exported JSON payloads with it's alerts and thresholds depending on active/idle periods of system accordingly (our system is active 8-10h daily outside of weekends). It works quite well.
But.
Whenever you work with dashboards in Grafana Web GUI you have to keep in mind that whenever you make any changes to anything dumping JSON dashboards and committing them to "Grafana Scheduler" repo is MANDATORY. If you forget about dumping your payload (South Park S11E09) your changes will be lost whenever scheduler kicks in (recoverable, but painful). And you have to propagate your change to both active/idle JSON dumps, which basically means double the effort (plus even more if differences are not documented accordingly). Effectively this "solution" means you need a well documented, maintained, visible and strictly followed _process_ to deal with, which in a long-shot might suck even more than not having this feature at all. We change our alert thresholds so rarely that it seems to be not much of a hassle for us to deal with _process_ overhead.
Anyway...
I'm working with Aiven Grafana right now which is running on top of SQLite (enforced by provider), so if database was changed to something more concurrent and feature-rich one can figure out how to employ database triggers+events to handle those small partial updates made via Grafana Web GUI so it can make the whole process more seamless.
Stay tuned, good luck!
 donsokolone
on 30 Jul 2019
donsokolone
on 30 Jul 2019
Please add this to get done, this is definitely needed for migrations from other platforms.
 buggsdummy
on 8 Aug 2019
buggsdummy
on 8 Aug 2019
The simple way with T-SQL queries is to cheat GRAFANA (workaround):
SELECT timestamp AS time,
        CASE
            WHEN DATEPART(HOUR, SYSDATETIME()) NOT IN (0,1,2,3,4,5,6)
            THEN COUNT(document_number)
            ELSE 0
        END AS Receipts
FROM GRAFANA.dbo.ReceiptsErrorsHistory
WHERE timestamp >= DATEADD(DAY, -7, GETDATE())
AND document_type = 'receipt'
GROUP BY timestamp
 mikelogaciuk
on 10 Sep 2019
mikelogaciuk
on 10 Sep 2019
What's the status of this implementation? We're currently using seyren and cabot for alerting, and would like to migrate to Grafana alerting. Without the time restriction, we won't be able to move forward.
 Nuadvocate
on 1 Oct 2019
Nuadvocate
on 1 Oct 2019
In Elastic search case, I found easy way to solve this issue.
Use date math : https://www.elastic.co/guide/en/elasticsearch/client/net-api/7.x/date-math-expressions.htm.
for example, if you want data with range (AM 00:00 ~ PM:12:00) then @timestamp:[now/d TO now/d+12h] will may return wanted result
 sukjoonhong
on 11 Oct 2019
sukjoonhong
on 11 Oct 2019
@sukjoonhong I cannot make it work. Do you have a screenshot please ?
Atem18
on 11 Oct 2019
I've got a workaround for this in place which uses cron to turn alerts on and off. This would only work if you want to turn ALL alerts off overnight (or if you can be bothered scripting individual alerts).
In crontab on the grafana box, I added:
1 * * * * root /root/do-alert-thing.sh
And in /root/do-alert-thing.sh:
#!/bin/bash

#Enable at 6am local
TZ='Somewhere/Sometime' date +%H | grep '06' && (
  curl http://localhost:3000/api/admin/pause-all-alerts -d '{"paused":false}' -u [email protected]:letmein -H 'Content-Type: application/json'
)

#Disable at 9pm local
TZ='Somewhere/Sometime' date +%H | grep '21' && (
  curl http://localhost:3000/api/admin/pause-all-alerts -d '{"paused":true}' -u [email protected]:letmein -H 'Content-Type: application/json'
)
Just replace Somewhere/Sometime with your timezone (tip: run timedatectl list-timezones for a list), and add your credentials instead of [email protected]. This admin endpoint only works in Basic auth mode per the documentation.
Hope this helps someone out there.
 davidhusselmann
on 13 Oct 2019
davidhusselmann
on 13 Oct 2019
@Atem18
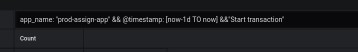
In my case, this query worked.
sukjoonhong
on 14 Oct 2019
@sukjoonhong Thanks I will give it a try !
Atem18
on 14 Oct 2019
I've got a workaround for this in place which uses cron to turn alerts on and off. This would only work if you want to turn ALL alerts off overnight (or if you can be bothered scripting individual alerts).
In crontab on the grafana box, I added:
1 * * * * root /root/do-alert-thing.shAnd in /root/do-alert-thing.sh:
#!/bin/bash

#Enable at 6am local
TZ='Somewhere/Sometime' date +%H | grep '06' && (
  curl http://localhost:3000/api/admin/pause-all-alerts -d '{"paused":false}' -u [email protected]:letmein -H 'Content-Type: application/json'
)

#Disable at 9pm local
TZ='Somewhere/Sometime' date +%H | grep '21' && (
  curl http://localhost:3000/api/admin/pause-all-alerts -d '{"paused":true}' -u [email protected]:letmein -H 'Content-Type: application/json'
)
Just replace Somewhere/Sometime with your timezone (tip: run
timedatectl list-timezonesfor a list), and add your credentials instead of[email protected]. This admin endpoint only works in Basic auth mode per the documentation.Hope this helps someone out there.
I tried this and works, but in grafana ui it says it only pauses for an hour. So I'd have to make a crontab which repeats itself every hour until ....?
 Marctraider
on 10 Nov 2019
Marctraider
on 10 Nov 2019
I approached this from a different angle where you generate a prometheus on/off metric based on the output of a script, for example a ps command that checks if the backup script is running. Then in my dashboard I have a "Backup Active" to display the backup status and in my primary panel with all of my queries and alert, I add the condition check which won't alert if the backup metric is = 1. This approach would also allow you to add a separate alert that fires if the backup runs longer than it should when you factor in the historical metric data.
 chrisfw
on 10 Nov 2019
chrisfw
on 10 Nov 2019
I've got a workaround for this in place which uses cron to turn alerts on and off. This would only work if you want to turn ALL alerts off overnight (or if you can be bothered scripting individual alerts).
In crontab on the grafana box, I added:
1 * * * * root /root/do-alert-thing.sh
And in /root/do-alert-thing.sh:#!/bin/bash #Enable at 6am local TZ='Somewhere/Sometime' date +%H | grep '06' && ( curl http://localhost:3000/api/admin/pause-all-alerts -d '{"paused":false}' -u [email protected]:letmein -H 'Content-Type: application/json' ) #Disable at 9pm local TZ='Somewhere/Sometime' date +%H | grep '21' && ( curl http://localhost:3000/api/admin/pause-all-alerts -d '{"paused":true}' -u [email protected]:letmein -H 'Content-Type: application/json' )Just replace Somewhere/Sometime with your timezone (tip: run
timedatectl list-timezonesfor a list), and add your credentials instead of[email protected]. This admin endpoint only works in Basic auth mode per the documentation.
Hope this helps someone out there.I tried this and works, but in grafana ui it says it only pauses for an hour. So I'd have to make a crontab which repeats itself every hour until ....?
Not sure why you're seeing that behaviour; for me it pauses and stays paused for 9 hours, until I unpause it using the morning cron line.
davidhusselmann
on 10 Nov 2019
I've got a workaround for this in place which uses cron to turn alerts on and off. This would only work if you want to turn ALL alerts off overnight (or if you can be bothered scripting individual alerts).
In crontab on the grafana box, I added:
1 * * * * root /root/do-alert-thing.sh
And in /root/do-alert-thing.sh:#!/bin/bash #Enable at 6am local TZ='Somewhere/Sometime' date +%H | grep '06' && ( curl http://localhost:3000/api/admin/pause-all-alerts -d '{"paused":false}' -u [email protected]:letmein -H 'Content-Type: application/json' ) #Disable at 9pm local TZ='Somewhere/Sometime' date +%H | grep '21' && ( curl http://localhost:3000/api/admin/pause-all-alerts -d '{"paused":true}' -u [email protected]:letmein -H 'Content-Type: application/json' )Just replace Somewhere/Sometime with your timezone (tip: run
timedatectl list-timezonesfor a list), and add your credentials instead of[email protected]. This admin endpoint only works in Basic auth mode per the documentation.
Hope this helps someone out there.I tried this and works, but in grafana ui it says it only pauses for an hour. So I'd have to make a crontab which repeats itself every hour until ....?
Not sure why you're seeing that behaviour; for me it pauses and stays paused for 9 hours, until I unpause it using the morning cron line.
Not saying I'm seeing that behavior, but it literally says it in the grafana UI. Paused for 1 hour. So I assumed the pause trick only works for 1 hour.
But if this is false I stand corrected.
Marctraider
on 10 Nov 2019
Not saying I'm seeing that behavior, but it literally says it in the grafana UI. Paused for 1 hour. So I assumed the pause trick only works for 1 hour.
But if this is false I stand corrected.
This might just be the alert status; e.g. if the alert was OK, it would show:
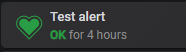
I'm guessing if it has been paused for an hour, it'd say "PAUSED for 1 hour" ?
davidhusselmann
on 10 Nov 2019
Stupid me, I think I must've misinterpreted 🍡
Thanks for the clarification!
Marctraider
on 10 Nov 2019
Is there any plan to implement this feature in 6.6.x > versions after Four years?
 llmuculusll
on 20 Jan 2020
llmuculusll
on 20 Jan 2020
We are still looking forward to see this implemented as well. This is a very ineffective alert system if users that are free, on vacation or otherwise unavailable are spammed with alerts when they don't need to respond on.
We would very much like to include option to set various hours (for our case business hours) to alert.
perplexityjeff
on 4 Feb 2020
Same here, would be very nice to have this.
Workarounds for some backends exist (I use one for MySQL which involves filtering events outside certain time ranges via the query), but having this as "proper feature" would definitely be a plus.
 opajonk
on 14 Mar 2020
opajonk
on 14 Mar 2020
We'd also love to see this feature in a future release. It would be helpful to be able to filter out/suppress alerts during our 'after hours' windows. For example, if we could have alerts filtered out if they occur after 8pm and prior to 8am the next day.
 loudmouse
on 6 Apr 2020
loudmouse
on 6 Apr 2020
It would be great to get this feature, please. As it stands now, it is like the kid crying wolf at night. I just put my phone in the drawer. The alert is useless. Thank you.
 GeorgeGomez
on 19 Apr 2020
GeorgeGomez
on 19 Apr 2020
We are in serious need of Acknowledgement functionality of Grafana. Without Acknowledge Alert function, Grafana Alerting function cannot be used in Critical Production Service Environment.
 anshul27jain
on 20 Apr 2020
anshul27jain
on 20 Apr 2020
It would be great to see this feature in Grafana. Only alerts during specific hours are relevant for us, working hours +-2hrs, during night there is a (planned) rise of the monitored values which currently results in alerts :-(
 stm2roi3
on 23 Apr 2020
stm2roi3
on 23 Apr 2020
+1 on feature request
 mishras
on 12 May 2020
mishras
on 12 May 2020
This will be great feature if we can add alarms for specific time regions. Alarm rules should only work for a specific time region.
 vbulbul
on 26 May 2020
vbulbul
on 26 May 2020
Could be great to have a way to configure different notifying channels regarding timeperiods, such as :
- a normal Monday -> notify via Slack
- 1st January Monday -> notify via SMS
Time periods can be user-defined and linked to a notifying channel.
 Xat59
on 1 Jun 2020
Xat59
on 1 Jun 2020
I skimmed most of the comments, so apologies if someone articulated the following use case, but I didn't notice it.
A reason to support time of day restrictions for alerts is for sparse data series. Consider a setup when a batch job executes once a day, some time between midnight and 2am in order to prepare data for a daily 8am briefing. The single data point of "job completed" is emitted upon completion.
There is not a good way to alert on this without a time restriction.
"Alert if no data point within the past X hours" will not work for any count of X hours. For example, if I alert on "no data point within the past 24 hours", then that works as long as all the jobs execute correctly every day. However, if I get a failure, and re-run the job at 11am to catch up. Then my alert for the next day is broken (since it won't trigger until after 11am). This is my primary use case for time restriction. The only practicable alert is to have the alert evaluation logic ON from 2am-8am and alert if "no data point within the past 8 hours".
This use case isn't about suppressing alerts during work hours, or reducing noise around specific time of day. Even with 24/7 on-call response, the alert above cannot be accurately expressed without time of day restrictions.
 tristanls
on 17 Jun 2020
tristanls
on 17 Jun 2020
+1 to this feature.
In our case, it is necessary to send an alert with information for the last N days once a day/hour/week. Everything is complicated by the fact that the newsletter must be done at a strictly fixed time (8:00, 13:00 and so on).
As a workaround, we plan to manage alerts via HTTP Api, but we would like to see this functionality in the client part of the grafana.
 M0rdecay
on 13 Jul 2020
M0rdecay
on 13 Jul 2020
Need this feature. Example: PROD network with Maintenance Hours - Now want to stop some notifications during this maintenance Window. e.g every Sunday night between specific time frame. Not possible in the moment.
 wurai-tech
on 29 Jul 2020
wurai-tech
on 29 Jul 2020
I'll really like this feature when available. I would like to stop alerting for the specific time period in a 24 hour range.
 smehta12
on 30 Jul 2020
smehta12
on 30 Jul 2020
+100000
 DonatasR
on 11 Aug 2020
DonatasR
on 11 Aug 2020
👍 +1
I think it's an essential feature to use Grafana as a true alerting engine.
Although the actual service maintains a in-healthy state, the metric may change according to the specified schedule.
We need a general way to control our alerts during that schedule.
 yheonhochoi
on 25 Aug 2020
yheonhochoi
on 25 Aug 2020
+1
This would be a nice feature to have at the client side. Right now we have to derive fields like hourOfDay, dayOfWeek, in Logstash in order to have them present in ES for adding an extra metric to the metric set, and add it in the alerting rules.
Alert me if avg metric A which is CPU usage is over 90% for 1m
AND
if metric B which is max hourOfDay of same documents is between RANGE.
It works, but it feels awkward working like this, as a workaround.
Most specially since Grafana has evolved tremendously since 2016 on other areas, but this is kind of forgotten since 2016.
 fjlour
on 26 Aug 2020
fjlour
on 26 Aug 2020
I've got a workaround for this in place which uses cron to turn alerts on and off. This would only work if you want to turn ALL alerts off overnight (or if you can be bothered scripting individual alerts).
In crontab on the grafana box, I added:
1 * * * * root /root/do-alert-thing.shAnd in /root/do-alert-thing.sh:
#!/bin/bash

#Enable at 6am local
TZ='Somewhere/Sometime' date +%H | grep '06' && (
  curl http://localhost:3000/api/admin/pause-all-alerts -d '{"paused":false}' -u [email protected]:letmein -H 'Content-Type: application/json'
)

#Disable at 9pm local
TZ='Somewhere/Sometime' date +%H | grep '21' && (
  curl http://localhost:3000/api/admin/pause-all-alerts -d '{"paused":true}' -u [email protected]:letmein -H 'Content-Type: application/json'
)
Just replace Somewhere/Sometime with your timezone (tip: run
timedatectl list-timezonesfor a list), and add your credentials instead of[email protected]. This admin endpoint only works in Basic auth mode per the documentation.Hope this helps someone out there.
Hi
Can you tell me how to get individual alerts url ?
 harinutech
on 28 Aug 2020
harinutech
on 28 Aug 2020
Hi
Can you tell me how to get individual alerts url ?
harinutech
on 28 Aug 2020
It's a pity that after 4 years this obviously demanded feature hasn't been implemented. My use case is a simple home automation where the router has to be restarted from time to time (it's ISP's one and cannot survive longer than a week of uptime). I have a simple socket adapter with a dial that resets the router every night. So every night I get lots of alerts about my sensors being down in Telegram. A simple feature of disabling alerting during certain time interval would come in handy.
It doesn't have to be super sophisticated scheduling straight away. In the first version of this feature it could be just time of day. With more complex schedules being added at later stages
 maxim-kukushkin
on 5 Oct 2020
maxim-kukushkin
on 5 Oct 2020
Do we have any way to schedule alerts at particular instance of time.
 Donderia
on 25 Nov 2020
Donderia
on 25 Nov 2020
+1 for this feature.
 zhaopinglu
on 10 Dec 2020
zhaopinglu
on 10 Dec 2020
Does grafana support a modulo operation? Then, you should be able to use the identity function to get the unix time as an additional metric in your panel. With the modulo function you could get the remainder of the division of the unix time by 86400 (the number of seconds in a day). Then you could add a range condition on the time metric in your alert. Right?
Would it be difficult to add the modulo operation for this purpose?
It sounds crazy but it works and for my use case it was sufficient. 😅
time() % 86400
Still, it's a pain that there isn't a more convenient solution that isn't an obvious hack. 🤦
 ochrstn
on 21 Dec 2020
ochrstn
on 21 Dec 2020
It sounds crazy but it works and for my use case it was sufficient. 😅
time() % 86400Still, it's a pain that there isn't a more convenient solution that isn't an obvious hack. 🤦
@ochrstn what version of grafana do you have as I tried this on v6.6.1 and the modulo operation was essentially ignored in the query?
 TylerBrinkley
on 23 Dec 2020
TylerBrinkley
on 23 Dec 2020
It sounds crazy but it works and for my use case it was sufficient. 😅
time() % 86400Still, it's a pain that there isn't a more convenient solution that isn't an obvious hack. 🤦
@ochrstn what version of grafana do you have as I tried this on v6.6.1 and the modulo operation was essentially ignored in the query?
v6.6.2 🙈
ochrstn
on 23 Dec 2020
Does grafana support a modulo operation? Then, you should be able to use the identity function to get the unix time as an additional metric in your panel. With the modulo function you could get the remainder of the division of the unix time by 86400 (the number of seconds in a day). Then you could add a range condition on the time metric in your alert. Right?
Would it be difficult to add the modulo operation for this purpose?It sounds crazy but it works and for my use case it was sufficient.
time() % 86400Still, it's a pain that there isn't a more convenient solution that isn't an obvious hack.
Hey @ochrstn :) Could you provide details on how you've done this?
 LLCampos
on 29 Dec 2020
LLCampos
on 29 Dec 2020
Related issues
 jackmeagher
·
3Comments
jackmeagher
·
3Comments
 KlavsKlavsen
·
3Comments
KlavsKlavsen
·
3Comments
 utkarshcmu
·
3Comments
utkarshcmu
·
3Comments
 royemmerich
·
3Comments
royemmerich
·
3Comments
 ricardclau
·
3Comments
ricardclau
·
3Comments
Most helpful comment
As a workaround, using prometheus as backend:
hour(), that returns the hour of the day (0-23). You can make it hidden in the graph.ANDcondition to your alert, so it's only alerting if thehour()query is between the range you want (eg: office hours).The same can be done with
day_of_week().