Grafana: Set home dashboard on user and org level
I would like to edit the Home dashlist but there is no 'save' button:

If you click away you get the unsaved dialog warning, and if you choose to save it actually creates one in the db:

Still, this one in the db is not the default page when you login and I can't find anyway to make it the default [like you could in 1.9.1]. My preference would be that each user can have their default home page from the db, which if unconfigured could use the read-only 'Home' like it appears we have today.
 dutchiechris
All 78 comments
This was one feature that was left on the cutting room floor for 2.0, Might have time to implement it for 2.0 but it might be pushed to 2.1
 torkelo
on 31 Mar 2015
torkelo
on 31 Mar 2015
Hey @maddenca a temporary fix, you can go into the public/dashboards folder and edit the home.json and manually edit them until the feature is added.
 jlwise
on 8 Apr 2015
jlwise
on 8 Apr 2015
+1 on being able to edit the "Home" dashboard
 tmonk42
on 6 May 2015
tmonk42
on 6 May 2015
+1
Edit : please also consider having a different home for different organizations
 Akeru
on 18 May 2015
Akeru
on 18 May 2015
+1
 pavleec
on 1 Jun 2015
pavleec
on 1 Jun 2015
I'd like to customize this page as well - thanks to @jlwise for the tip on how to hack the file manually in the meantime.
 phrend
on 2 Jun 2015
phrend
on 2 Jun 2015
+1 very useful feature with a big installation while users have totally different focus on the data.
 OliverKuhn
on 15 Jun 2015
OliverKuhn
on 15 Jun 2015
+1
 hanej
on 27 Aug 2015
hanej
on 27 Aug 2015
+1
 dforste
on 27 Aug 2015
dforste
on 27 Aug 2015
+1
 elijahsgh
on 27 Aug 2015
elijahsgh
on 27 Aug 2015
+1
 syabro
on 27 Aug 2015
syabro
on 27 Aug 2015
+1
 mordaha
on 27 Aug 2015
mordaha
on 27 Aug 2015
+1
 Slach
on 28 Aug 2015
Slach
on 28 Aug 2015
+1
 AlekSi
on 6 Sep 2015
AlekSi
on 6 Sep 2015
As a workaround, you can redirect the user to the desired dashboard in home.json by using something similar to this in rows:
"rows": [
  {
    "height": "50px",
    "panels": [
      {
        "id": 1,
        "span": 12,
        "type": "text",
        "mode": "html",
        "title": "Initializing...",
        "content": "<script>window.location = 'dashboard/script/home';</script>"
      }
    ]
  }
],
 eliperelman
on 11 Sep 2015
eliperelman
on 11 Sep 2015
@eliperelman so dirty 😄
 sc0rp10
on 11 Sep 2015
sc0rp10
on 11 Sep 2015
@sc0rp10 yep, hacks!
eliperelman
on 11 Sep 2015
+1, i found the play demo site is OK, but the master code can't do that --- custom the home page
@eliperelman , Yes, you are right, it helped me.
The json body can copy from "pannel JSON"

 xiaoping378
on 16 Sep 2015
xiaoping378
on 16 Sep 2015
+1
 tuxinaut
on 28 Sep 2015
tuxinaut
on 28 Sep 2015
+1
 damm
on 3 Nov 2015
damm
on 3 Nov 2015
+1
 mochaslave
on 10 Nov 2015
mochaslave
on 10 Nov 2015
+1
 hmilkovi
on 12 Nov 2015
hmilkovi
on 12 Nov 2015
+1 It will be really useful to create a Main Dashboard with Tag Filtering as a primary view. In actual configuration, is really basic to have a complete view of existent dashboards in an Organization.
 pasancario
on 25 Nov 2015
pasancario
on 25 Nov 2015
I kinda wanted to nest it; one large custom dashboard leading to several mini dashboards... if you have a lot it kinda gets messy and I love having everything on a single page without scrolling.
damm
on 25 Nov 2015
I am using whisper db where can i find the saved dashboards in whisper. (OR) where does it store
Thanks
 venkatdba64
on 11 Dec 2015
venkatdba64
on 11 Dec 2015
Grafana does not store dashboards in whisper. Grafana saves users and dashboards in it's own database (/var/log/grafana/grafana.db if you use sqlite3, or in mysql or postgres is you configured that)(
torkelo
on 12 Dec 2015
+1
 synthead
on 9 Feb 2016
synthead
on 9 Feb 2016
+1 :)
 m0nikasingh
on 15 Feb 2016
m0nikasingh
on 15 Feb 2016
+1
 oiooj
on 26 Feb 2016
oiooj
on 26 Feb 2016
+1
 alvaromunoz
on 3 Mar 2016
alvaromunoz
on 3 Mar 2016
Started some work in #4251
 utkarshcmu
on 4 Mar 2016
utkarshcmu
on 4 Mar 2016
I look at the above all the answers, but I still don't understand
 hugoren
on 7 Mar 2016
hugoren
on 7 Mar 2016
Understand what?
torkelo
on 7 Mar 2016
oh, how to set the "Home page"
hugoren
on 8 Mar 2016
grafana'version is 2.6
hugoren
on 8 Mar 2016
I see your vedio on YouTube too. You are very greate!
https://www.youtube.com/watch?v=sKNZMtoSHN4&index=7&list=PLDGkOdUX1Ujo3wHw9-z5Vo12YLqXRjzg2
hugoren
on 8 Mar 2016
Implemented and merged to master, will be included in 3.0 stable (or 3.0 beta2 if that happens)


torkelo
on 3 Apr 2016
:+1: Thanks!
 commarla
on 7 Apr 2016
commarla
on 7 Apr 2016
Wow, this is great. Thanks a lot!
synthead
on 7 Apr 2016
I can only select "Default" (using beta3).
 jaegr
on 11 Apr 2016
jaegr
on 11 Apr 2016
@jaegr i guess you need to star the dashboard which you need to make as home page. Then you will be able to select it instead of default.
utkarshcmu
on 11 Apr 2016
Will a tooltip to help describe the fact that the dropdown only shows starred dashboards
torkelo
on 11 Apr 2016
@utkarshcmu thanks a lot!
 bienkma
on 5 May 2016
bienkma
on 5 May 2016
@bienkma Its @torkelo we all should thank for this great tool and its lightening fast development. :)
utkarshcmu
on 5 May 2016
Pardon the necrobump: what is the rationale behind the a Dashboard needing to be starred before it shows up in Profile > Preferences > Home Dashboard?
Personally, I would rather see a list of all available dashboards. I would be happy to add this functionality if it's the consensus.
 beigeforce
on 21 Jun 2016
beigeforce
on 21 Jun 2016
It's a simple select drop down, thousands of dashboards would not be nice there, so limit to only starred. Why is this a problem?
torkelo
on 21 Jun 2016
You can't star dashboard stored on disk. For db boards "star, change config, unstar" is not very pleasant way too.
 uhriap
on 18 Jul 2016
uhriap
on 18 Jul 2016
This doesn't seem to show up in 4.0 at all. I cannot see it on the Org Management screen or User Management screens.
 willneumob
on 10 Dec 2016
willneumob
on 10 Dec 2016
It's there. Sure your on 4.x?
Should be a preferences section, where one option is Home dashboard
On 10 Dec 2016 17:54, "willneumob" notifications@github.com wrote:
This doesn't seem to show up in 4.0 at all. I cannot see it on the Org
Management screen or User Management screens.—
You are receiving this because you were mentioned.
Reply to this email directly, view it on GitHub
https://github.com/grafana/grafana/issues/1678#issuecomment-266222079,
or mute the thread
https://github.com/notifications/unsubscribe-auth/AAAq92EgU0QnY9cDcTamJS-cWXq6gNh5ks5rGtlEgaJpZM4D327P
.
torkelo
on 10 Dec 2016
Sorry, found it, I just got "Org Settings" and "Org Preferences" mixed up. Thanks!
willneumob
on 12 Dec 2016
+1 to being able to edit the home dashboard. Using the new default for the Org lets me create a new dashboard to serve as home, but it also means that the new dashboard "pseudo-home" is now in my dashlist, which I don't like. Thanks for all you guys do.
 sbcdave
on 26 Mar 2017
sbcdave
on 26 Mar 2017
+1 to editing Home dashboard without requiring creating a new dashboard and setting that as the new default for user or org.
 trent
on 14 Apr 2017
trent
on 14 Apr 2017
This still doesn't work. I tried setting the Organization default dashboard id through the API, the request was accepted but it didn't stick. In the dropdown under org preferences, nothing appears other than 'Default'.
 ageis
on 8 May 2017
ageis
on 8 May 2017
@ageis strange, we have no reports on this failing. What was the command you sent? does it work when you change it from the UI ?
torkelo
on 9 May 2017
@torkelo sorry, I now set it through the UI after having to "star" it. (I missed or misread that hint...) however, the API call should've worked... it was like this.
curl -XPUT -H "Authorization: Bearer redacted" localhost:3000/api/org/preferences [email protected]
org.json:
{
  "theme": "dark",
  "homeDashboardId":3,
  "timezone":"utc"
}
Try setting content type header
torkelo
on 9 May 2017
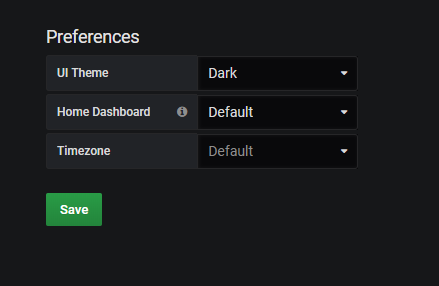
Only "Default" dashboard available in the field even if I follow the tip to start the dashboard and try after.
Grafana 5.0
 joaogvmoura
on 6 Jun 2018
joaogvmoura
on 6 Jun 2018
Ok, it's been 3 years, this issue is marked as "fixed", but it's still present.
Either the default home dashboard needs to be not editable, or you need to be able to save changes you make to it.
The fact that the "default" dashboard can be edited implies that it's something you can make stick.
This issue needs to be re-opened.
 fake-name
on 30 Jun 2018
fake-name
on 30 Jun 2018
You can set a custom home dashboard in org or profile settings. You can save changes to the default home dashboars using the save as feature in the dashboard settings view.
torkelo
on 1 Jul 2018
@torkelo is it possible to provision the default dashboard for the default org? My grafana installation runs without persistence in a container, so users will be deleted at container recreation (linked with github they are recreated at sign in automatically).
 ramato-procon
on 31 Jul 2018
ramato-procon
on 31 Jul 2018
Not currently, we need to add org & user provisioning for that
torkelo
on 31 Jul 2018
hey @torkelo , Is there a way we can create any other dashboard as home dashboard e.g. I want to set cluster status, so whenever a user signs in, he sees that rather than the home page. The method mentioned above using Preferences needs manual intervention, I want it to be automatic, isn't there any flag or variable that can be set?
 kahootali
on 6 Aug 2018
kahootali
on 6 Aug 2018
You can set it in Organization preferences, it will be used for all users who have not defined their own home dashboard
torkelo
on 6 Aug 2018
@torkelo but I would have to open Grafana UI for it and change preferences manually, I don't want that rather I want when I am setting up grafana through the grafana.ini config, at that point is there any way to edit it?
kahootali
on 6 Aug 2018
Makes your product look bad when you have an edit button that doesn't have a save. Disable edit or add save please.
 gilescope
on 28 Nov 2018
gilescope
on 28 Nov 2018
What? There is a save button
torkelo
on 28 Nov 2018
Agreed
George "Dave" Goldsmith
KWH Data Acquisition Lead
ECE | Veteran | Pilot | Medic
425.268.1938 | [email protected]
On Wed, Nov 28, 2018, 12:18 PM Connor Wolf <[email protected] wrote:
The point is the save button doesn't work. Either it should work (and
save the home page), or the home page should not be editable.Having something be editable, and have a save button, only to have the
save button just throw your changes away is actively user-hostile.—
You are receiving this because you commented.
Reply to this email directly, view it on GitHub
https://github.com/grafana/grafana/issues/1678#issuecomment-442590126,
or mute the thread
https://github.com/notifications/unsubscribe-auth/AOU92Qi6Vm2kFHPjS9h554BuuMIbDBQRks5uzu-ygaJpZM4D327P
.
sbcdave
on 28 Nov 2018
@gilescope @fake-name @sbcdave Your comments doesn't make sense in the context of this issue. Are you referring to the default home dashboard and when navigate to settings in that?
 marefr
on 29 Nov 2018
marefr
on 29 Nov 2018
The point is the save button doesn't work. Either it should work (and save the home page), or the home page should not be editable.
We have not reports that there is save button that does not work, can you open a new issue for that and detailed instructions on how to replicate?
torkelo
on 29 Nov 2018
I think he's indirectly reporting the same thing I did, and the same thing
others have, that the home page is not editable, but he's also mentioning
what I failed to, it seems like it is editable, but when you save the
changes don't persist.
George "Dave" Goldsmith
KWH Data Acquisition Lead
ECE | Veteran | Pilot | Medic
425.268.1938 | [email protected]
On Thu, Nov 29, 2018, 3:38 AM Torkel Ödegaard <[email protected]
wrote:
The point is the save button doesn't work. Either it should work (and save
the home page), or the home page should not be editable.We have not reports that there is save button that does not work, can you
open a new issue for that and detailed instructions on how to replicate?—
You are receiving this because you were mentioned.
Reply to this email directly, view it on GitHub
https://github.com/grafana/grafana/issues/1678#issuecomment-442802695,
or mute the thread
https://github.com/notifications/unsubscribe-auth/AOU92YlX01Yj35BcSxffQnmrZZEElv2pks5uz8cvgaJpZM4D327P
.
sbcdave
on 29 Nov 2018
So nothing to do with this issue. It is editable and you can save it using save as button. Will create a new dashboard that you can set as your new home dashboard (either on org or profile level)
torkelo
on 29 Nov 2018
I haven't tried it in a while and haven't upgraded to 5 yet, but I recall
there being a save button when I was "editing" the home page, that
basically did nothing because it didn't persist, and was frustrating.
That's why I related to this comment and agreed.
George "Dave" Goldsmith
KWH Data Acquisition Lead
ECE | Veteran | Pilot | Medic
425.268.1938 | [email protected]
On Thu, Nov 29, 2018, 10:51 AM Torkel Ödegaard <[email protected]
wrote:
So nothing to do with this issue. It is editable and you can save it using
save as button. Will create a new dashboard that you can set as your new
home dashboard (either on org or profile level)—
You are receiving this because you were mentioned.
Reply to this email directly, view it on GitHub
https://github.com/grafana/grafana/issues/1678#issuecomment-442949119,
or mute the thread
https://github.com/notifications/unsubscribe-auth/AOU92dAvko7Mew4keq8g0RxapZeq-6-tks5u0CymgaJpZM4D327P
.
sbcdave
on 29 Nov 2018
Strange, we have never had a save button on the default home dashboard that I can recall.
torkelo
on 29 Nov 2018
@umeshabhat why are you +1 this? It's already been implemented long time ago.
marefr
on 21 Feb 2019
@marefr I've scoured the internet and still haven't found a solution :(
Although I do appreciate the suggestions to update the organization details through the API
- http://docs.grafana.org/http_api/org/#organization-api
- https://community.grafana.com/t/change-home-dashboard/7441/13
We would still appreciate provisioning in this regard. It would be nice to include it in a configuration that we may execute during our docker-compose builds.
Do let me know if I tagged the wrong issue and point me in the right direction. Much Appreciated.
 umeshabhat
on 21 Feb 2019
umeshabhat
on 21 Feb 2019
Also looking into this at the moment http://docs.grafana.org/tutorials/api_org_token_howto
umeshabhat
on 21 Feb 2019
@umeshabhat then it's the following feature request, #10266, you're interested in. Please always use the "Pick your reaction" when upvoting/showing interest in issue instead of writing +1. Everyone subscribed to an issue will get a notification when someone adds a +1 comment, but will not when using the "Pick your reaction" function.
marefr
on 21 Feb 2019
Alright, removed my +1.
umeshabhat
on 21 Feb 2019
Related issues
 Minims
·
3Comments
Minims
·
3Comments
 deepujain
·
3Comments
deepujain
·
3Comments
 Azef1
·
3Comments
Azef1
·
3Comments
 SATHVIKRAJU
·
3Comments
SATHVIKRAJU
·
3Comments
 calind
·
3Comments
calind
·
3Comments
Most helpful comment
Implemented and merged to master, will be included in 3.0 stable (or 3.0 beta2 if that happens)