Grafana: Alerting support for queries using template variables
It would be pretty useful if grafana would support alerting for queries using template variables. The way I see it work it would be as follows:
- Generate queries foreach template variable combination (discarding template variable for __all__)
- When generating queries, consider the frozen list if the template variable is set to never refresh, else update the template variable list
- Allow filtering (trough regex or by providing a static value) for each template variable
The current workaround is to use an invisible wildcard metric, but the problem I see with this approach is that it loses context.
 calind
All 126 comments
+1
 oiooj
on 13 Nov 2016
oiooj
on 13 Nov 2016
- What would be the difference compared to just using all?
 bergquist
on 14 Nov 2016
bergquist
on 14 Nov 2016
+1
Would be nice to be able to add alerting on server with a low life time (AWS auto scaling), auto register the server on grafana is easy with the templating but it's sad to not be able to put alerting on them
 antoiner77
on 14 Nov 2016
antoiner77
on 14 Nov 2016
@bergquist it's unpractical using all for example when you have more than a dozen hosts.

If for example only few of them are failing, (let's say 5), it is very useful to receive an email for each failing alert. This way is also much easier to integrate with other tools which in general expect one alert per metric.
The current approach (using all) is pretty neat though when there are fewer instances or when you are alerting at service level (eg. # of jobs in queue).
calind
on 15 Nov 2016
what @calind said, i've got multiple $host variables wich are working fine with the influxDB but not with the alerts
 Deshke
on 15 Nov 2016
Deshke
on 15 Nov 2016
+1 as well.
Just a thought, since you are able to query with a template variable, wouldn't you just be able to do the same query with the alerting metrics and maybe iterate through the results to see which meet the alert criteria?
 NotSoCleverLogin
on 18 Nov 2016
NotSoCleverLogin
on 18 Nov 2016
@NotSoCleverLogin It would be possible. But would you want to change the behavior of alert rule based on what template varlue are selected?
Using the all option for the template is the only way that makes sense for me.
bergquist
on 18 Nov 2016
+1
I have a setup of X environments with the same components in each environment. We are currently using prometheus to alert on e.g cpu usage/disk usage etc. There we specify an alert for a query, and when the alert is triggered it will just state which environment the alert was triggered from.
If we would do this with the All variable, that would work to some extent. But, using @calind's example, the screenshot would be filled with the trend of all cpus from all of my environments, and not just the environment where I would want to be informed about said problem. The graph will (or can) be obscured with information from other environments. In some scenarios it could be interesting to compare cpu in other environments, but there are no guarantees that what is happening in a test environment is happening in our production environment, etc.
We are also looking into creating dashboards that can be used by operations, showing annotations for alerts in the "standard" overview dashboard. Given that we use 'env' template variables for these kind of dashboards it's not really possible for us to do that with how it is implemented right now. I would have to manually (at least to some extent) generate a "shadow" dashboard where the alerts are triggered (which makes me loose the annotations in the overview dashboard).
Another thing I think template variables can help you do is to route the alerts (should you choose to implement such a feature) to different sources (some to operations if in production, to qa/developers if in test environments etc).
 mstaalesen
on 22 Nov 2016
mstaalesen
on 22 Nov 2016
+1 for supporting alerts on templated queries.
 StianOvrevage
on 23 Nov 2016
StianOvrevage
on 23 Nov 2016
@bergquist, some dashboards don't have an _All_ option. For example system metrics by collectd (https://grafana.net/dashboards/24). Having an _All_ option would certainly not be practical for let's say 10 or more servers. That's why the need to iterate trough template variables.
calind
on 24 Nov 2016
Allowing use of All is a good and welcomed start.
In Prometheus, queries need to be written in a different way to allow All:
some.metric{hostname=~"$Hostname"}
Notice the extra tilde there, allowing for regular expression searching (and the wildcard in All).
I have not benchmarked the possible performance impact of going from a straight query to a regex search query but at least for now it would apparently solve our problems.
StianOvrevage
on 25 Nov 2016
+1
 max3163
on 29 Nov 2016
max3163
on 29 Nov 2016
+1
 jordandev
on 29 Nov 2016
jordandev
on 29 Nov 2016
not sure how it should be implemented, just know it's needed..
 steverweber
on 2 Dec 2016
steverweber
on 2 Dec 2016
+1
We use Prometheus as the Datasource to monitor our Kubernetes Infrastructure for bout our On-Prem K8S Clusters and our AWS K8S Clusters.
All of our dashboards use Templated Variables for the Datasource ($Environment), $Instance/Node, $Namespace, and $Pod.
Due to the way the Prometheus Query Structure is; all of the queries have Templated Variables; which prevents the Alert Rules from allowing to save.
I would love to see Templated Variable Queries added to the alerting.
 Krylon360
on 2 Dec 2016
Krylon360
on 2 Dec 2016
+1
 andrewawagner
on 6 Dec 2016
andrewawagner
on 6 Dec 2016
+1
We use templating dashboards for multi-server environment which is the logical way (and many people use), So we can't use alerting with grafana right now. The only way is to have a separate non-templating dashboard or setup alerting with prometheus itself which is not easy.
 shervinkh
on 7 Dec 2016
shervinkh
on 7 Dec 2016
perhaps if there was an option or simple way to save/export a dashboard with the template variables backed/pre-rendered into all the fields... this would perhaps be a good half way point until another solution is found.
steverweber
on 8 Dec 2016
+1 for supporting alerts on templated queries. We currently use templating on all our dashboards so can't take advantage of this really cool feature.
 daraeburn
on 12 Dec 2016
daraeburn
on 12 Dec 2016
+1, we have a lot of templated dashboards, and we can't use alerting for now, we have to deduplicate dashboards for having alerts, and we so lose templating power
 tsn77130
on 12 Dec 2016
tsn77130
on 12 Dec 2016
+1, Almost all of our dashboards use template variables (and nested template variables).
We would like to be able to set alerts on repeat panels to get individual alerts per template-variable group if needed. Plus this means that the alerting is dynamic and not super manual as it is now.
DANGER: Variables in theory will be good to have, but we need to keep in mind that if some guy goes into your dashboard and changes the value and saves, the resulting alerting will be affected. Don't know if that's ok behaviour or not, will be complicated.
 drewboswell
on 12 Dec 2016
drewboswell
on 12 Dec 2016
+1
 ebirukov
on 12 Dec 2016
ebirukov
on 12 Dec 2016
When working with grafana it feels like templating is encouraged everywhere and it feels wrong to create an extra set of graphs not using variables just to use the alerting feature...
 erSitzt
on 12 Dec 2016
erSitzt
on 12 Dec 2016
+1 for supporting alerts on templated queries.
also, we found that when we use Chinese ruleName or Chinese title, we received abnormal email with rule triggered. For example, we expected “个股分时线接口请求时间(getTimeTrend) alert” but received "个è¡åæ¶çº¿æ¥å£è¯·æ±æ¶é´(getTimeTrend) alert", maybe the charset is not correct.
 kanwangzjm
on 13 Dec 2016
kanwangzjm
on 13 Dec 2016
+1 to implement templated vars in alerts
 AlexMaksimkin
on 14 Dec 2016
AlexMaksimkin
on 14 Dec 2016
+1
 fingul
on 15 Dec 2016
fingul
on 15 Dec 2016
+1 would get a great addition
 drew-royster
on 17 Dec 2016
drew-royster
on 17 Dec 2016
+1
 tj13
on 20 Dec 2016
tj13
on 20 Dec 2016
+1 to implement templated vars in alerts
 felixculpaq
on 20 Dec 2016
felixculpaq
on 20 Dec 2016
+1
 bbae-dev
on 22 Dec 2016
bbae-dev
on 22 Dec 2016
+1 looking forward for it
bbae-dev
on 22 Dec 2016
+1
 clhlc
on 23 Dec 2016
clhlc
on 23 Dec 2016
+1
 staslev
on 29 Dec 2016
staslev
on 29 Dec 2016
+1
 actionjax
on 30 Dec 2016
actionjax
on 30 Dec 2016
+1
 jesseorr
on 30 Dec 2016
jesseorr
on 30 Dec 2016
Please stop writing +1!
Everybody that has subscribed to this issue will get an email...
There is a github feature only to get rid of those +1 comments:
https://github.com/blog/2119-add-reactions-to-pull-requests-issues-and-comments
 thetechnick
on 30 Dec 2016
thetechnick
on 30 Dec 2016
@thetechnick There is a link in the e-mail where you can mute the thread and not receive any e-mails. But I understand that you might want to just get notified when the feature is complete, but I also like to get the issue bumped so that it hopefully will get worked on sooner :)
StianOvrevage
on 2 Jan 2017
Great progress on alerting overall.
For the template variables in alerting, I am missing it as well. +1 :D
=
On top of that there might be a bug in a way Grafana detect whether metric used in query uses the template variables.
When you've a series which uses the template variables indirectly, Grafana does not stop you to add that series as an alert. The alert obviously does not work correctly.
See the #K (it uses #D, which uses #A and #A uses templ. var):

I could still select it:

 tomekit
on 3 Jan 2017
tomekit
on 3 Jan 2017
Templates everywhere, which means alerting no where.
Not sure how the alerting has been implemented, but for a simple graph the query gets "translated", template variables substituted with values, before making a call to the data source, right? So why not in this case? In any way, as said before, having almost all of the queries using template variables, alerting is completely of for me. Please, could you implement it so that we don't have to move alerting outside Grafana? Thanks a lot!
 marketadvorackova
on 3 Jan 2017
marketadvorackova
on 3 Jan 2017
I think we should recognise that alerting with templating is not trivial and i think the ALL options is the way to go because we dont want our alerts changing when someone is using the dashboard.
But grafana still would have to create new alerts if the template query returns new results... which happens quiet often as we scale our apps.
This leads to more problems if you are using InfluxDB as many of us are using tags/tag values i guess, and there is no time filter for them... so grafana would create alerts for all service that ever existed on any host...
erSitzt
on 3 Jan 2017
+1
 HyperDevil
on 5 Jan 2017
HyperDevil
on 5 Jan 2017
Just allowing to specify datasource in alerting would be ok for me. It won't break any logic, and i can specify at least production and staging environments to watch for.
 yellowmegaman
on 5 Jan 2017
yellowmegaman
on 5 Jan 2017
ALL is an option, sure. More flexible would be a recognition of the template variables in the query and letting the user set the values up in the alert condition configuration. The best, but complicated I guess, would be to have multiple alerts (the same way there are multiple queries) so that a different alert could be set up for a different template variable values in the query. This would enable the administrator to set up different alert conditions for different hosts for example.
marketadvorackova
on 5 Jan 2017
Multiple alerting profiles would be great, but for an initial pass, just providing the same template selectors as are available on the dashboard in the alerting panel would solve a lot of problems.
I also think there should be an toggle for each variable to aggregate results for that variable into a single notification, this is probably only enabled for template vars that have multi-select enabled. This provides a simple but effective method to control the verbosity of notifications - you may want to notify only once for multiple related metrics, but notify for each host where any metric is failing. Or, you may want to notify only once for a failing metric no matter how many hosts are affected.
 pdf
on 14 Jan 2017
pdf
on 14 Jan 2017
do we have any targeted milestone for this bug ?
 siteshbehera
on 15 Jan 2017
siteshbehera
on 15 Jan 2017
I had some issues with the alerting on a complicated queries and template variables queries. I've found out easy workaround, which maybe not pretty, but it works for my use case.
It's just extracting the query after you built it, so there are no template variables and any #ROW references. This could be obvious for you, there is no rocket science, but to me it was life changer.
What I do is I prepare a query:

then extract it using the Chrome dev tools (copy target parameter value):

Put it in another row (switch to toggle edit mode first):

Set up the alerting:

Voila !
tomekit
on 15 Jan 2017
@siteshbehera This is not a bug. Its a feature request.
But no. We dont have a milestone for this currently.
bergquist
on 16 Jan 2017
artificial intelligence grafana plugin should be included in commit for this feature.
 lastsky
on 26 Jan 2017
lastsky
on 26 Jan 2017
Waiting for templates in Alerts too +1
 1stdemon
on 1 Feb 2017
1stdemon
on 1 Feb 2017
I'm also very much in favor of what calind provided as possible implementation in the opening post. It seems to fits neatly into how many (me included) use templated dashboards - where you have one dashboard, but switch/limit some variables to manually look at specific things. I think the example of the "server"-variable might be the most fitting one. There, the template variable (without _all_-value) would become something not unlike a "_tab_" in my dashboard - I can switch between them to see different sets of data. It's then easy to assume that, when setting up an alert, the alert would exist for each possible "_tab_" seperately.
 Faradax
on 1 Feb 2017
Faradax
on 1 Feb 2017
Waiting to support templates in Alerts +1
 fahimeh2010
on 7 Feb 2017
fahimeh2010
on 7 Feb 2017
As a previous user of Librato where alerting was partially capable of this templating I'd like to chime in with an equally partial solution. In Librato each metric comes with a 'source' variable, and alerts on a graph would automatically be per source.
I think an equal solution would satisfy the needs raised here. When creating an alert you should be able to choose a single template value as a 'source' and this source is mentioned in the alert, all others being set to 'all'. This solution at least avoids the combinatorics problem you get if allowing the use of multiple template variables.
Myself I just set an invisible max or min graph over the data I'm interested and do the alert on it, not as powerful but still a working solution until this issue is resolved.
 danhallin
on 7 Feb 2017
danhallin
on 7 Feb 2017
Hi, I'm definitely looking for this feature as, with the majority of cases before, all of my dashboards are using templated queries to support multiple environments (at least).
Is there a place where the roadmap of grafana is being tracked? Or any way that we can see if features (like this one) will be implemented in a future (near or not so near) without poking mantainers on github? :)
 nadirollo
on 8 Feb 2017
nadirollo
on 8 Feb 2017
Amazing really eagerly waiting for this one
 yannispanousis
on 9 Feb 2017
yannispanousis
on 9 Feb 2017
+1
 artemrootman
on 14 Feb 2017
artemrootman
on 14 Feb 2017
+1
 AlexeyKolychev
on 16 Feb 2017
AlexeyKolychev
on 16 Feb 2017
We are still not sure how to do this.
I think reusing the selected template variable for alerting would be dangerous since people can choose to view just one option and then forget to change back to All or something wider. I would not feel safe with such behavior. Alert rules should be extremely easy to understand and reason about. Explicit rules > magic rules.
One solution for this problem would be to have two values for each template variable. One for visualization in the dashboard and one for alerting. This would make it possible to always have the wider option in alerting and still select just a few options in the graphs. Connecting those values should be possible but not the default behavior.
That solution how every would be fairly large and complex feature.
bergquist
on 20 Feb 2017
I have two proposals for a solution.
A short term proposal is to add an alerting option so that in the rendered garph (the one being sent by email) only metrics which are alerting are being displayed. This would solve the clutter when the alerting graph contains dozens of metrics.
A long term solution would be to iterate trough template variables, so that you have an distinct alert for each template value combination.
calind
on 20 Feb 2017
As I mentioned back in november. For prometheus users just using 'All' as variable value is sufficient if the queries are written properly ( some.metric{hostname=~"$Hostname"} ).
Should probably also be very easy to implement.
StianOvrevage
on 20 Feb 2017
@bergquist I think option 2 is heading in the right direction (a partial implementation of what I suggested in https://github.com/grafana/grafana/issues/6557#issuecomment-272588490), it doesn't seem too complex, since the code to handle template var selection already exists for the dashboard, and there's no need to duplicate the var configuration, just selection. I don't think I'd bother connecting the dashboard selection to alerting in the first pass at this feature.
pdf
on 20 Feb 2017
i solved it by creating a new metric query just for the alert, without the template variables and disabled it (to exclude it from the graph) on Grafana version v4.1.1.
 rahulredde9
on 3 Mar 2017
rahulredde9
on 3 Mar 2017
+1 to implement templated vars in alerts
 arnobroekhof
on 14 Mar 2017
arnobroekhof
on 14 Mar 2017
+1 to implement templated vars in alerts
 seb-margineanu-ft
on 20 Mar 2017
seb-margineanu-ft
on 20 Mar 2017
Does this affect _all_ versions of Grafana? Or was this a feature that was available before? This is kind of a deal breaker for me and wouldn't mind installing a previous version.
 alejandroandreu
on 23 Mar 2017
alejandroandreu
on 23 Mar 2017
@alejandroandreu alerting was added in version 4, it has never worked with templating.
 gjgreen
on 23 Mar 2017
gjgreen
on 23 Mar 2017
+1 to implement templated vars in alerts
 iter00
on 23 Mar 2017
iter00
on 23 Mar 2017
I would like to be able to select / enter the combinations that the alerts should evaluate, since some of the environments that I run are not production environments, There are two ways to implement this, The first one is more explicit, the second one is easier to configure.
Enter all the wanted combinations manually
- This configuration should be shown in the Alert configuration panel
For example, If I have 3 templates variables : cloud, region and type, I would fill a table that looks like this :
| cloud | region | type |
|-------|------------|------|
| aws | us-east-1 | prod |
| aws | us-west-1 | prod |
| azure | Central US | prod |
The table should have extra row for inserting new rows and delete button for every row.
Enter possible values and Grafana will calculate Cartesian Product
- Note: This configuration can be entered in the template variable configuration panel
| cloud | region | type |
|-------|------------|------|
| aws | us-east-1 | prod |
| azure | us-west-1 | |
| | Central US | |
The combinations that will be created for this input are :
awsus-east-1prodawsus-west-1prodawsCentral USprodazureus-east-1prodazureus-west-1prodazureCentral USprod
But Grafana can handle this situation by "entering" the first variable (cloud), and then filtering the available values from the second variable (region) until it finds all the possible combinations (note - it should be done iteratively for all the variables) . This is possible when people use queries in the tags like this :
SHOW TAG VALUES WITH KEY = "REGION" WHERE "CLOUD" =~ /$CLOUD/
And in this case, the produced combinations will be fine (which is the same as the table in the first option) :
awsus-east-1prodawsus-west-1prodazureCentral USprod
I hope my suggestions will be helpful.
 shanielh
on 30 Mar 2017
shanielh
on 30 Mar 2017
We have this issue (OpenTSDB data source) in a slightly different context - if you use a template var to select a downsample interval in the metric, the alert query fails with error 400. I understand the difficulties in implementing a general solution but we are going to have to re-engineer various existing dashboards to enable alerting.
 dbcook
on 5 Apr 2017
dbcook
on 5 Apr 2017
@dbcook sounds like a distinct problem that you should probably file a separate issue for.
pdf
on 6 Apr 2017
Templating is really an awesome feature, and so is alerting. We'd better to have them working together smoothly instead of any awkward workaround.
 skygragon
on 12 Apr 2017
skygragon
on 12 Apr 2017
@tomekit Thanks for the workaround, it does look promising while we are waiting for the real implementation. However I can't find where to extract the query using the Chrome dev tools and am hence unable to copy the target parameter value for the new query. I have tried "Inspect Element" but I am struggling to find "Name" or "Headers" or "Form Data" that you have shown on the screenshot.
Would you please be able to illustrate the steps to do that? Your help will be highly appreciated!
Thanks
 mathurj
on 26 Apr 2017
mathurj
on 26 Apr 2017
@mathurj It is the Network -> XHR tab. Does it help now?

Then click on the "render" request.
tomekit
on 26 Apr 2017
Thanks @tomekit I can see this page now however I cannot see any request named "render". There however is another request about the query that I am executing, but it does not have any "target" parameter.
Any leads on how to go about the "render" request?
mathurj
on 26 Apr 2017
@mathurj I get the "render" request, once looking on one of the graphs on my dashboard and clicking refresh (top right corner).
tomekit
on 26 Apr 2017
Tried it, still no "render" request for me :( And no "target" paremeter too. Thanks anyway for your help @tomekit . Guess i'll have to wait for the actual implementation, which might be a while by the looks of it. @bergquist @torkelo ?
mathurj
on 26 Apr 2017
ok working with
some.metric{hostname=\~"$Hostname"}
in the query itself is fine,
but its my datasource that is the template here...

environment=\~"$environment"
doesn't seem to work... any way for this to work did I mis anything? or should I get rid of the template :disappointed:
 SvenDhaens
on 18 May 2017
SvenDhaens
on 18 May 2017
+2
 matthew-churcher
on 8 Jun 2017
matthew-churcher
on 8 Jun 2017
this feature is especially useful when using the prometheus as the data source!
 dikang123
on 14 Jun 2017
dikang123
on 14 Jun 2017
I need this as well, for similar reasons as mentioned above. I expect this to work as a for each loop over the entire collection that the template defines.
 drekle
on 23 Jun 2017
drekle
on 23 Jun 2017
We need this!!! :) 👍
 helletheone
on 4 Jul 2017
helletheone
on 4 Jul 2017
Personally I'm in support of this feature as well. We are testing more than one system with a set of load tests that generate delay metrics. Instead of having one dashboard we are using a variable to switch between the datasources that hold the data for the various systems in order to just have to maintain one board and not script them.
Hence a support for templates in alerts would be highly appreciated.
 Baiteman
on 4 Jul 2017
Baiteman
on 4 Jul 2017
+1
we need this too
 eloo
on 10 Jul 2017
eloo
on 10 Jul 2017
+1
we need this too
 svenkirsten
on 27 Jul 2017
svenkirsten
on 27 Jul 2017
+1
we need this too
 swift1911
on 28 Jul 2017
swift1911
on 28 Jul 2017
Can I ask why there are so many guys "thumb down" those +1 replies??
skygragon
on 28 Jul 2017
@skygragon it's essentially useless spam when the option to +1 the original post exists. Just click the thumbs-up icon in the first post.
 austinbutler
on 28 Jul 2017
austinbutler
on 28 Jul 2017
Template variables and alerting are 2 of the best features of Grafana.
Sad to see they are mutually exclusive though......
 secure12
on 16 Aug 2017
secure12
on 16 Aug 2017
+1
 yzargari
on 20 Aug 2017
yzargari
on 20 Aug 2017
@bergquist could your team discuss this again and hopefully put a milestone on this? It's the most requested feature for almost 2 years now and I bet quite a few users would be happy with getting this feature.
 rogerfar
on 23 Aug 2017
rogerfar
on 23 Aug 2017
No good solution has yet been proposed and we are still pretty sure this is a bad idea as it's mixing two features that serve different purposes. Templating variables are used for dynamic dashboards & exploration. Alert rules can already by made to be dynamic with regex / wildcard queries. Mixing these two seems like a terrible idea, at least in way that is understandable & predictable.
There are some good reasons though to support it in some limited way but not sure it's going to be worth the extreme complexity it would add and the development cost. But we are open to ideas, suggestions & PRs.
 torkelo
on 23 Aug 2017
torkelo
on 23 Aug 2017
The issue is I have quite a few servers I monitor AND they are dynamicaly created through Amazon, so at a given time I don't know how many servers are up.
I have a templated graph that shows CPU for each server (for example), so I would like alerting on there too.
But you are saying I could achieve the same by using wildcards?
rogerfar
on 23 Aug 2017
@yesman85 well of course, depends on your time series store. but most support some form of glob/regex query syntax to target multiple metrics that follow a naming pattern.
torkelo
on 23 Aug 2017
@torkelo I believe this is the first time that this position has been stated publicly. I think maybe there's some misunderstanding here - I don't believe users want the template values selected for dashboard output to affect alerting, but instead to have the same template selections available when configuring alerts.
Relevant implementation suggestions from this thread:
https://github.com/grafana/grafana/issues/6557#issuecomment-272588490
https://github.com/grafana/grafana/issues/6557#issuecomment-281049641 (option 2)
Also, related issues:
https://github.com/grafana/grafana/issues/6041
https://github.com/grafana/grafana/issues/6553
https://github.com/grafana/grafana/issues/6983
https://github.com/grafana/grafana/issues/7252
These limitations have stopped us from being able to use Grafana for alerting in anger, because the only ways to do so that sort of work currently are to either add a bunch of separate hidden queries for alerting, or to create separate dashboards for alerting vs display. Both options are a maintenance nightmare, and rather limit the great potential that Grafana has for easy monitoring configuration and interpretation by users.
pdf
on 23 Aug 2017
I think my suggestion above inspired by Libratos source-based alerting gives a limited, understandable and predictable solution which seem to cover almost all of the above mentioned problems.
In grafana it would translate to being able to use one and only one template variable for alerting and each value in that variable would generate its own alert. You could possible also add a regex on it for filtering in / out which ones you want to create alerts on.
danhallin
on 23 Aug 2017
@pdf I agree that https://github.com/grafana/grafana/issues/6041 is a big limitation, one that we definitely want to fix but is unrelated to this issue. It's bad that we haven't fixed it yet I agree, we have been a bit understaffed on the alerting side last couple of months but that will change soon!
@danhallin that is not the same, seems it would translate to a query in Grafana that targets many series using a wildcards or glob expressions in your query or only filters on a limited set of tags? Librato alert rules are defined separately from dashboards are they not so how can it translate to a dashboard wide data filtering feature?
way to do so that sort of works currently is to add a bunch of separate hidden queries for alerting, which is a maintenance nightmare
Understand that mixing in alert rules in your templated graphs like that is a nightmare. But think supporting template variables in alerting could be an even bigger nightmare. Probably a stupid question, but can you not built dashboards & graphs that are focused on alerting? and leave the dashboards with many template variables for exploration and troubleshooting? I know there are probably many cases where they would be similar so feels like duplicated work :( The problem with alert rules in the context of a dashboard with a couple of template variables is how it should work & be understandable, and how it can even be implemented at all.
Say one query uses 2 template variables, $A, and $B they each have 50 values. Would this result in evaluating the alert rule 2500 times? I mean if the variables are "single value", ie the queries are built to only work if $A and $B have a single value then we would have to do that. Not a show stopper maybe, we would have to explain only multi value variables are supported. There are probably many more limitations & problematic details that will make this feature very hard to implement & use & understand
But I am not 100% against it, think there might be a way to do it in a limited way (like only supporting one
multi valued variable). There is also the use case of having multiple data sources and being able to target a datasource variable in your alert rule in order to reuse those alert rules across many data centers / environments (that have separate TSDBs) that use case would have to be solved using a data source template variable as a metric query with wildcards cannot solve it.
torkelo
on 23 Aug 2017
but can you not built dashboards & graphs that are focused on alerting? and leave the dashboards with many template variables for exploration and troubleshooting? I know there are probably many cases where they would be similar so feels like duplicated work :(
I did actually edit my comment to reference this option (and add a couple of the other alert-related pain-point issues). As you've identified though, this means multiplying dashboard/panel creation (and maintenance, if all those queries need an update) by the number of template variations you want to alert on, and also segregates the alert annotations from the location they may be most useful in - a templated dashboard with alert annotations can be very useful for making correlations, but not so much if you have to try and explore across multiple browser tabs and try to line things up.
Say one query uses 2 template variables, $A, and $B they each have 50 values. Would this result in evaluating the alert rule 2500 times? I mean if the variables are "single value", ie the queries are built to only work if $A and $B have a single value then we would have to do that. Not a show stopper maybe, we would have to explain only multi value variables are supported. There are probably many more limitations & problematic details that will make this feature very hard to implement & use & understand
There are two separate issues here I think. One _is_ (I believe) closely related to #6041, in that there may be a desire to evaluate alert conditions individually per series/template values (the aggregate toggle I mentioned in an earlier comment). If we put that aside for now, I believe the ideal way to solve the bulk of this issue is to allow multiple alert configs per panel, and just do variable interpolation in exactly the same way as for dashboard output: allow users to select single- or multi-value template values when configuring alert queries; the queries will be executed once per alert config, with the selected values populated; and the results will be interpreted exactly the same way as they currently are. Unless I'm grossly misunderstanding something, I don't see this as a significant increase in complexity, and should be quite user-friendly.
The ability to select template values to simply limit alerting scope would still be useful without multiple alerting configs (if it helps to develop this functionality in that order), but would be exponentially more valuable with multiple configs.
There is also the use case of having multiple data sources and being able to target a datasource variable in your alert rule in order to reuse those alert rules across many data centers / environments (that have separate TSDBs) that use case would have to be solved using a data source template variable as a metric query with wildcards cannot solve it.
Multiple alert configs/queries per panel would provide a method for dealing with multiple TSDBs, and one option might be to allow grouping alert queries, so that state transitions occur based on the result of all queries in the group (similar to how things currently work for series). Doesn't seem too complicated.
pdf
on 23 Aug 2017
This is definitely a popular need.. Now to achieve Alerting we had to move
away from Grafana and create our custom solution using Graphite's Render
APIs raw data .. I don't think supporting Alerts in dynamic / templated
data is any complex atleast using Graphite..
One more thought is,. Why Grafana has Alerts section is part of dashboard
config if this is considered complex. You can move it away to separate
Alerting view where users can jus input / config their dynamic query,
interval, evaluation condition over there.. May be this could mean we
don't hav duplicate dashboards.. Makes sense?
BR,
Vishwa..
On 23-Aug-2017 8:01 AM, "Peter Fern" notifications@github.com wrote:
but can you not built dashboards & graphs that are focused on alerting?
and leave the dashboards with many template variables for exploration and
troubleshooting? I know there are probably many cases where they would be
similar so feels like duplicated work :(I did actually edit my comment to reference this option (and add a couple
of the other alert-related pain-point issues). As you've identified though,
this means multiplying dashboard/panel creation (and maintenance, if all
those queries need an update) by the number of template variations you want
to alert on, and also segregates the alert annotations from the location
they may be most useful in - a templated dashboard with alert annotations
can be very useful for making correlations, but not so much if you have to
try and explore across multiple browser tabs and try to line things up.Say one query uses 2 template variables, $A, and $B they each have 50
values. Would this result in evaluating the alert rule 2500 times? I mean
if the variables are "single value", ie the queries are built to only work
if $A and $B have a single value then we would have to do that. Not a show
stopper maybe, we would have to explain only multi value variables are
supported. There are probably many more limitations & problematic details
that will make this feature very hard to implement & use & understandThere are two separate issues here I think. One is (I believe) closely
related to #6041 https://github.com/grafana/grafana/issues/6041, in
that there may be a desire to evaluate alert conditions individually per
series/template values (the aggregate toggle I mentioned in an earlier
comment). If we put that aside for now, I believe the ideal way to solve
the bulk of this issue is to allow multiple alert configs per panel, and
just do variable interpolation in exactly the same way as for dashboard
output - allow users to select single- or multi-value template values when
configuring alert queries; the queries will be executed once per alert
config, with the selected values populated; and the results will be
interpreted exactly the same way as they currently are. Unless I'm grossly
misunderstanding something, I don't see this as a significant increase in
complexity, and should be quite user-friendly.The ability to select template values to simply limit alerting scope would
still be useful without multiple alerting configs (if it helps to develop
this functionality in that order), but would be exponentially more valuable
with multiple configs.—
You are receiving this because you are subscribed to this thread.
Reply to this email directly, view it on GitHub
https://github.com/grafana/grafana/issues/6557#issuecomment-324363795,
or mute the thread
https://github.com/notifications/unsubscribe-auth/AAz1sbIwOT7Xb1MwoDYgZCPz182h2ENxks5sbD62gaJpZM4Kwf5K
.
 vishwanathh
on 23 Aug 2017
vishwanathh
on 23 Aug 2017
@danhallin that is not the same, seems it would translate to a query in Grafana that targets many series using a wildcards or glob expressions in your query or only filters on a limited set of tags? Librato alert rules are defined separately from dashboards are they not so how can it translate to a dashboard wide data filtering feature?
I see now that what I'm discussing is basically a copy of: https://github.com/grafana/grafana/issues/6041
I'm in support of that feature request over this one.
danhallin
on 24 Aug 2017
We spin up servers regularly and we have templated dashboards that measure common things across all hosts (mem, hd, cpu, etc). Making an "alert" dashboard having graphs for each possible combination is too tedious, many of the desired alerts can be generalized across all the hosts. AFAIKT this issue is asking for a way to make this use case possible and would not be solved in #6041. Unless I'm missing something.
 wavded
on 24 Aug 2017
wavded
on 24 Aug 2017
Making a graph & alert for every combination is not what we are proposing, just that you alert query uses wildcards or regex so that it covers all hosts etc. Then you have one alert and graph that can be tuned for alerting and not be competing with requirements for troubleshooting & dynamic filtering.
torkelo
on 24 Aug 2017
For our usecase we have a number of (potentially) ephemeral instances providing realtime processing of events - we'd need to be alerted if certain application generated metrics drop to 0. However, if instances are removed or halted they will still have a named metric associated with them that shows up in a straight wildcard search leading to falsely generated alerts.
Have gotten around this by using a templated, multi-value variable (set to All) generated from a "Simple JSON Datasource" that contains a source of truth for what instances should be running - all working perfectly. Alas, as soon as I attempted to enable alerting I was led to this feature request :)
Not sure how unique our particular use-case is but I'm not sure of any other way to alert on this without the use of templating - for now, we will need to continue alerting for these issues outside of Grafana (which is a shame - we're very heavy Grafana users!)
 pdolan
on 14 Sep 2017
pdolan
on 14 Sep 2017
+1
 olsib
on 24 Nov 2017
olsib
on 24 Nov 2017
So one case where we don't have any of these issues is where the template variable is a constant type. For instance, we have multiple dashboards relying on a constant variable to limit the data on that dashboard to a particular resource (the reason we didn't use a multi-value variable is because each dashboard is different enough to justify different setups but close enough to justify a "template" dashboard). At least in this case (constant variables) nothing about the current alerting behavior needs to change.
 JonathanTroyer
on 20 Dec 2017
JonathanTroyer
on 20 Dec 2017
Any news about this topic?
 crazy-canux
on 24 Jan 2018
crazy-canux
on 24 Jan 2018
Hi,
Is there any hopes of getting this feature? i just wonder how other systems are having this features as they must also be using sort of templating as when we install agent it automatically gets appears on portal and alerting can also be set for that. (This is my experience with New Relic).
@vishwanathh i liked the approach of having separate section for alerting (if it is being complicated to has it in graph panel) where we can put in our queries just for alerting. as this way our users will not see the placeholder panel(used for alerting).
Sorry for the extra noise but this would be a really great feature to have in Grafana.
 ashuw018
on 28 Jan 2018
ashuw018
on 28 Jan 2018
+1, very very important feature!
 tangyong
on 30 Jan 2018
tangyong
on 30 Jan 2018
In addition, if letting me modify prometheus metric query expression to remove template variable, this is not feasible at all. So, I think that this feature is most important for the prometheus+grafana to land on production!
Anyway, please team can consider the priority, thanks!
tangyong
on 30 Jan 2018
With 5.0 heading out the door shortly, I'd love to see some significant focus given alerting during the next release series. Looking at Github reactions, alerting-related deficiencies appear to have far-and-away the most interest from users.
I know there has been some reluctance to tackle these things due to UI/UX complexity concerns, however I'm not convinced these concerns are necessarily justified. Is there anything we as users can do that might help planning/design or to move these issues forward, short of pull-requests with actual code?
pdf
on 2 Feb 2018
@torkelo This has helped me to setup alerting for all of my hosts using tags and now my each alerting graph contains multiple series formed by the combination of tags. Everything seemed to be working fine. But going through the docs and other issues i realized that if any of the series within graph has already took alerting state then alerts for other series will not be trigger if they also crossing limit.
Thats again being limitations.
Thanks.
ashuw018
on 2 Feb 2018
Any news about this feature ?
 deiv061
on 9 Feb 2018
deiv061
on 9 Feb 2018
What's the effort for a new contributor to add this feature?
 spiffytech
on 9 Feb 2018
spiffytech
on 9 Feb 2018
+1
 sjayaraman
on 14 Feb 2018
sjayaraman
on 14 Feb 2018
Please allow template variables to be used for Alert Notifications.
+1
 nookalavikas
on 19 Mar 2018
nookalavikas
on 19 Mar 2018
+1
 amihura
on 22 Mar 2018
amihura
on 22 Mar 2018
We hope to be resolved.
 Moon-Tae-Kwon
on 2 Apr 2018
Moon-Tae-Kwon
on 2 Apr 2018
+1
 rpelau
on 2 Apr 2018
rpelau
on 2 Apr 2018
I don't want to beat a dead horse here, but we're having the same issue, and I want to provide some context as to why the existing proposals don't work in all circumstances. I also have a couple of ideas for workarounds, but why we need _some features_ to help make the workarounds sufficient.
For all scenarios below, we're using a single templated variable: $env
"Why not just create alerting dashboards?"
We want to alert on a couple different environments, not just production. So we'd now need to have the same metric in _at least_ 3 different places (the troubleshooting dashboard with all metrics, not just the metric we alert for; the prod alerts dashboard; the integration alerts dashboard). This can get out of hand pretty quick, and is prone to user error.
Equally as important, this nullifies much of the gain from automated annotations from alerts. If I have to go back and forth from my exploratory dashboard to my alerts dashboard to see the annotations for when an event started and when it ended, that's going to be pretty tedious.
Attempted Solution
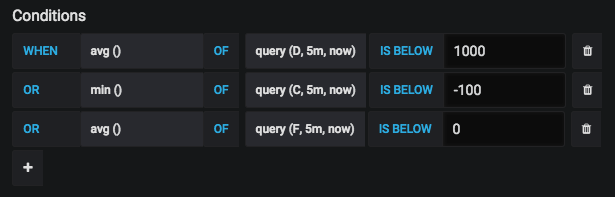
What we've done to try to get around this is we've added duplicate metrics _specifically for alerting_ to our dashboards. So if there's a metric we want to alert on, we go to the panel and add explicit metrics for those alerts (and hide them).
Our series list for a given panel that needs to alert will look along the lines of:

With the non-templated series marked as hidden. Then in the alerting tab, we set thresholds for _these_ series, not the variable series.
Problems with this solution
This doesn't work great though. For example:

As you can see, the Alerts panel doesn't allow us to specify _which environment_ is alerting -- so we have to drill down into the alert to figure out which environment is borked at the moment. However, an easy fix for this might be just allowing the description to be as verbose as the Alert History panel that shows state transitions:
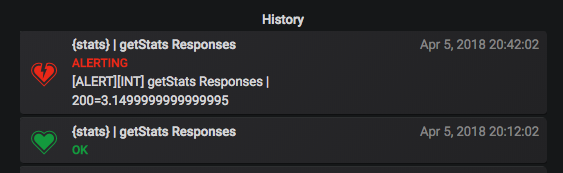
This is at least somewhat helpful, but even in this panel there's no indication of which alert has gone back to Healthy (the description from the above screenshot was derived from the alias we set on the series if anyone is wondering how to at least get that much to show up).
Things that would help until this specific ticket is resolved
- Allow the option for displaying the series alias instead of a typed description for the alert (this way the alias can at least specify the $variable it's alerting for)
- Allow the state transition back to healthy to also show the series alias (in the History screenshot above)
- Allow a legend value for active alerts (using the series alias I assume) for a given panel
Things I'm not sure how to fix
Annotations on graphs that have alerts configured for multiple environments/variables:

With this we can't really tell which alert is firing without going into the panel. The legend suggestion could help clarify this, but doesn't do much for the annotation if the correct $env isn't selected (in the above picture, int is alerting, but prod is the variable selected on the dashboard, so we're displaying annotations from the int alert over top of the graph using prod.
 calebtote
on 5 Apr 2018
calebtote
on 5 Apr 2018
+1
 unixway
on 9 Apr 2018
unixway
on 9 Apr 2018
plus one :)
 PheonixS
on 9 Apr 2018
PheonixS
on 9 Apr 2018
Please stop +1'ing this issue. It generates unnecessary spam emails. The ability to add a reaction to a github issue comment has existed for a while now, and over 429 people have figured out how to like the initial comment instead of spamming everybody who is subscribed.
 adamcstephens
on 9 Apr 2018
adamcstephens
on 9 Apr 2018
Please we really need this feature, we would like to use templating, but in our case is most important to have a clear alerting system. So to workaround this we are avoiding templating in our dashboard... its a mess.
 manueligno78
on 23 May 2018
manueligno78
on 23 May 2018
I agree and this feature will help us a lot !!!!
 thiagocorredor
on 30 May 2018
thiagocorredor
on 30 May 2018
+1 please
 kamzhuyuqing
on 28 Jun 2018
kamzhuyuqing
on 28 Jun 2018
we need this
 cmuzyunda
on 28 Jun 2018
cmuzyunda
on 28 Jun 2018
+1 please. It's really needed.
 ChahatB
on 29 Jun 2018
ChahatB
on 29 Jun 2018
@bergquist @torkelo can we please lock this issue to stop the +1 spam?
pdf
on 29 Jun 2018
Related issues
calind
·
3Comments
 tuxinaut
·
3Comments
tuxinaut
·
3Comments
 ericuldall
·
3Comments
ericuldall
·
3Comments
 tcolgate
·
3Comments
tcolgate
·
3Comments
 utkarshcmu
·
3Comments
utkarshcmu
·
3Comments
Most helpful comment
Please stop +1'ing this issue. It generates unnecessary spam emails. The ability to add a reaction to a github issue comment has existed for a while now, and over 429 people have figured out how to like the initial comment instead of spamming everybody who is subscribed.