Grafana: Support for multiple series & bars (side by side) for same time point
I have multiple data source on one single graph. For example I have 6 metrics on one single graph.Under chart options when i select bars they all show up on single bar line I want to show them as different bars ? How do i do that ? I have attached a sample image file.
The problem with having all of them on one single line is the last data source that i add takes up all the space on the bar.


 marshell08
All 115 comments
When having multiple series you must enable stacking when bars are enabled. There is no support for bars that are side by side (yet)
 torkelo
on 25 Sep 2014
torkelo
on 25 Sep 2014
i agree, i miss that as well. awaiting for the feature request ...
 tomerikko
on 16 Jan 2015
tomerikko
on 16 Jan 2015
:+1:
 catacgc
on 5 May 2015
catacgc
on 5 May 2015
+1
 sobolews
on 25 May 2015
sobolews
on 25 May 2015
+1
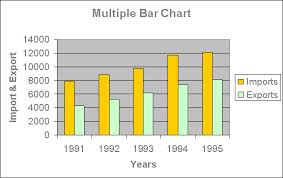
It would be great if we are able to draw something like the picture below ...

 paragdeuskar
on 23 Jun 2015
paragdeuskar
on 23 Jun 2015
:+1:
 jgr
on 21 Jul 2015
jgr
on 21 Jul 2015
+1
 hotsnow77
on 3 Aug 2015
hotsnow77
on 3 Aug 2015
+1
 KunalSaini
on 7 Aug 2015
KunalSaini
on 7 Aug 2015
+1
 msabramo
on 16 Aug 2015
msabramo
on 16 Aug 2015
I would also love the ability to stack series side by side.
This is our use-case:

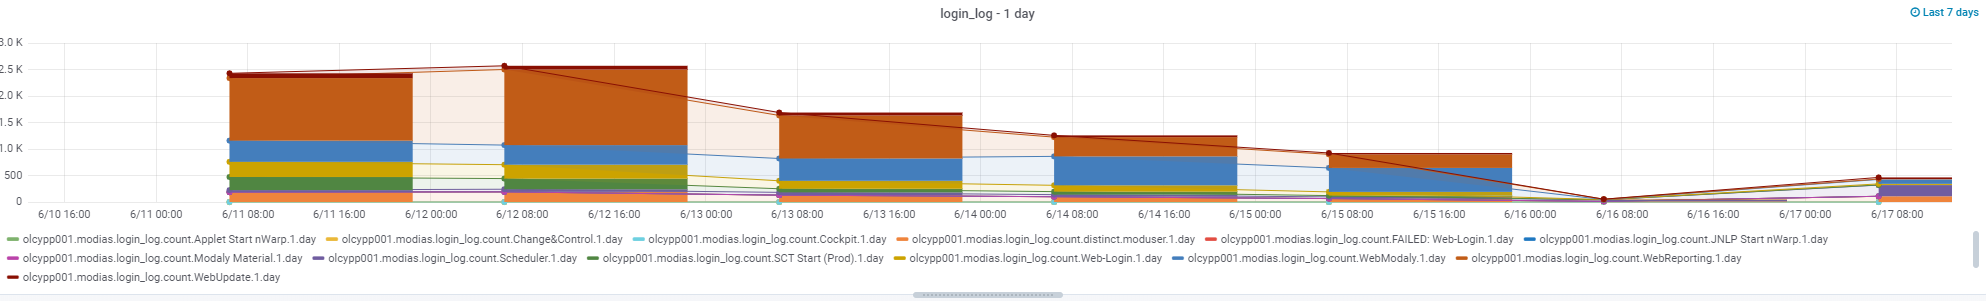
We're plotting the connection count over time, as well as the number of connections opened/closed for each bucket.
In the above graph, they're stacked on top of each other - however, it would be better if we could have the opens/closed side-by-side with each other, so you can better compare them.
(If you remove the stacking attribute, it seems to simply overlay the bar graphs on top of each other, which seems a bit...odd. I can't really see the use-case where you'd want that behaviour).
 victorhooi
on 28 Aug 2015
victorhooi
on 28 Aug 2015
+1
 mipapo
on 27 Sep 2015
mipapo
on 27 Sep 2015
+1
 kcnummija
on 25 Feb 2016
kcnummija
on 25 Feb 2016
+1
 edast
on 9 Mar 2016
edast
on 9 Mar 2016
+1
 mortkane
on 29 Mar 2016
mortkane
on 29 Mar 2016
+1
 nichdiekuh
on 29 Mar 2016
nichdiekuh
on 29 Mar 2016
+1
 evanbreznyik
on 30 Mar 2016
evanbreznyik
on 30 Mar 2016
+1
 girgen
on 1 Apr 2016
girgen
on 1 Apr 2016
+1!
 ricardoekm
on 4 Apr 2016
ricardoekm
on 4 Apr 2016
+1
 nvgoldin
on 14 Apr 2016
nvgoldin
on 14 Apr 2016
+1
 lucas-matt
on 19 Apr 2016
lucas-matt
on 19 Apr 2016
Are there any plans to have this implemented or is it a low priority thing for now?
 prawnsalad
on 14 May 2016
prawnsalad
on 14 May 2016
+1
 ryanb93
on 16 May 2016
ryanb93
on 16 May 2016
+1
 Nevett
on 30 May 2016
Nevett
on 30 May 2016
:+1:
 russellsilva
on 17 Jun 2016
russellsilva
on 17 Jun 2016
+1
 digrich
on 8 Jul 2016
digrich
on 8 Jul 2016
+1
 bdortch
on 8 Jul 2016
bdortch
on 8 Jul 2016
+1
Any timeline you guys have for this feature?
 anuragkyal
on 9 Jul 2016
anuragkyal
on 9 Jul 2016
+1
 timgl
on 12 Jul 2016
timgl
on 12 Jul 2016
+1
 dbiazus
on 26 Jul 2016
dbiazus
on 26 Jul 2016
+1
 sivad77
on 3 Aug 2016
sivad77
on 3 Aug 2016
+1
 gunererd
on 22 Aug 2016
gunererd
on 22 Aug 2016
+1
 seeallsea
on 7 Sep 2016
seeallsea
on 7 Sep 2016
+1
 jifwin
on 19 Sep 2016
jifwin
on 19 Sep 2016
+1
 KorkyPlunger
on 20 Oct 2016
KorkyPlunger
on 20 Oct 2016
+1
 petrslavotinek
on 26 Oct 2016
petrslavotinek
on 26 Oct 2016
+1
 sergeygalkin
on 11 Nov 2016
sergeygalkin
on 11 Nov 2016
Hello,
As I am seeing with all these requests, it becomes a high priority feature. Please help us!
 gwuillou
on 18 Nov 2016
gwuillou
on 18 Nov 2016
+1
 kavimaluskam
on 23 Nov 2016
kavimaluskam
on 23 Nov 2016
+1
 absolutejam
on 25 Nov 2016
absolutejam
on 25 Nov 2016
+1
 dburm
on 25 Nov 2016
dburm
on 25 Nov 2016
+1
 ivanovmi
on 25 Nov 2016
ivanovmi
on 25 Nov 2016
+1
 yamert
on 25 Nov 2016
yamert
on 25 Nov 2016
+1
 boris-42
on 25 Nov 2016
boris-42
on 25 Nov 2016
+1
 ehorohorin
on 26 Nov 2016
ehorohorin
on 26 Nov 2016
+1
 misterku
on 26 Nov 2016
misterku
on 26 Nov 2016
+1
 mmalchuk
on 26 Nov 2016
mmalchuk
on 26 Nov 2016
i++
 aserrr
on 26 Nov 2016
aserrr
on 26 Nov 2016
I've been briefly looking at this and it should be quite easy with jquery.flot.orderBars plugin.
The only a bit more complicated thing would be calculating the bars width.

petrslavotinek
on 26 Nov 2016
+1
 rkhozinov
on 26 Nov 2016
rkhozinov
on 26 Nov 2016
Looks neat!
jifwin
on 26 Nov 2016
+1
 geri4
on 26 Nov 2016
geri4
on 26 Nov 2016
+1
 mbaran0v
on 26 Nov 2016
mbaran0v
on 26 Nov 2016
+1
 posox
on 26 Nov 2016
posox
on 26 Nov 2016
+1
 kuntashov
on 26 Nov 2016
kuntashov
on 26 Nov 2016
+1
 CyrilMazur
on 1 Dec 2016
CyrilMazur
on 1 Dec 2016
+1
 danielzheng
on 9 Dec 2016
danielzheng
on 9 Dec 2016
+1
 stefanverhoeff
on 12 Dec 2016
stefanverhoeff
on 12 Dec 2016
+1
 ldktta
on 12 Dec 2016
ldktta
on 12 Dec 2016
+1
 source-ram
on 15 Dec 2016
source-ram
on 15 Dec 2016
Please stop this "+1" noise and use the reactions. Thank you!
 neckhair
on 16 Dec 2016
neckhair
on 16 Dec 2016
@petrslavotinek Would you mind pushing your changes up to a fork, or otherwise share what you have so far there? It would be nice to be able to patch it in ourselves, and perhaps submit as a PR if we can get it in good shape.
 cincodenada
on 9 Apr 2017
cincodenada
on 9 Apr 2017
I've created a fork with a new branch: https://github.com/petrslavotinek/grafana/tree/bars_side-by-side.
It works, but it's very basic.
Especially computation of width and spacing of the bars needs some improvement.
I will work on it but no sooner than the next week (after Easter holiday).
petrslavotinek
on 12 Apr 2017
Is there a plan to include this functionality in the main repo?
 haidaraM
on 18 May 2017
haidaraM
on 18 May 2017
While this functionality is desired by many (myself included), I feel that it would not be in the best interest of properly representing time series data; if your x axis is time, non-stacked elements would indicate different timestamps for the data.
 previousdolphin
on 25 Sep 2017
previousdolphin
on 25 Sep 2017
@previousdolphin: It depends on the way the x axis is shown. Normaly in Grafana the Grid is aligned with the time. In this layout one time is exactly on this line, as you wrote and non-stacked elements would indicate different timestamps:

But it is also possible to layout the grid in a different way. As you can see on the graph below the time is not written on a grid line. This symbolized, that the grouped graphs belong to the same timesatamp:
 JonasGutermuth
on 26 Sep 2017
JonasGutermuth
on 26 Sep 2017
It the second example is a time locked referential chart with buckets on the x-axis representing entire years.
I do not know how you would do / show this, within Grafana, which is designed to show the x-axis as a continuous representation of regular time intervals.
Perhaps they could overlay, and then have some clever animation to spread on a mouse over, and collapse back when your cursor is away?
On Sep 26, 2017 at 2:17 AM,
@previousdolphin (https://github.com/previousdolphin): It depends on the way the x axis is shown. Normaly in Grafana the Grid is aligned with the time. In this layout one time is exactly on this line, as you wrote and non-stacked elements would indicate different timestamps:
But it is also possible to layout the grid in a different way. As you can see on the graph below the time is not written on a grid line. This symbolized, that the grouped graphs belong to the same timesatamp:
—
You are receiving this because you were mentioned.
Reply to this email directly, view it on GitHub (https://github.com/grafana/grafana/issues/870#issuecomment-332097385), or mute the thread (https://github.com/notifications/unsubscribe-auth/AZ5TCsfpxGrHTEZYPwUjCoSd81AFe_mQks5smJcNgaJpZM4Cm6KU).
previousdolphin
on 28 Sep 2017
+1
 leandro-ss
on 3 Jan 2018
leandro-ss
on 3 Jan 2018
+1
 vascomedici
on 19 Jan 2018
vascomedici
on 19 Jan 2018
+2 !!!
 olivierdemin
on 22 Jan 2018
olivierdemin
on 22 Jan 2018
+1
 cobab
on 2 Feb 2018
cobab
on 2 Feb 2018
+1
 kccheung
on 8 Feb 2018
kccheung
on 8 Feb 2018
@victorhooi can u explain how you got this connection count over time graph. actually mine use case is also similar to this. i have two queries which i want to be stacked. and multiple series side by side(like many buckets ). i want exactly the same kind of graph like what you posted here.
 singhmeghna79
on 15 Feb 2018
singhmeghna79
on 15 Feb 2018
Google has code that can be used to create charts: http://gwt-charts.appspot.com/
 devcode2
on 20 Feb 2018
devcode2
on 20 Feb 2018
@devcode2 Grafana doesnot supports it . How to implement it in grafana?
singhmeghna79
on 7 Mar 2018
Hey. Our team working on implementing this here:
https://github.com/CorpGlory/grafana-multibar-graph-panel (it is hackable!)
Please support idea to extract graph panel so it would be easier to maintain the fork https://community.grafana.com/t/repo-for-graph-panel/5895/3
 jonyrock
on 7 Mar 2018
jonyrock
on 7 Mar 2018
+1
 argreway
on 27 May 2018
argreway
on 27 May 2018
+1
 nthienan
on 28 Jun 2018
nthienan
on 28 Jun 2018
+1, really need this feature
 CamilleGR
on 28 Jun 2018
CamilleGR
on 28 Jun 2018
@CamilleGR @nthienan you can see link above with implementation. There are already people involved and they support the feature
jonyrock
on 28 Jun 2018
I really need this feature since https://github.com/CorpGlory/grafana-multibar-graph-panel does not work well, there are many issues. When does Grafana plan for this feature?
nthienan
on 5 Jul 2018
+1, I need this feature as well, as https://github.com/CorpGlory/grafana-multibar-graph-panel does not work on grafana 5.
kccheung
on 14 Aug 2018
I agree that this feature would be very useful indeed. The current alternatives do not seem very good.
 GarinSmith
on 14 Aug 2018
GarinSmith
on 14 Aug 2018
+1
 jbalooka
on 15 Aug 2018
jbalooka
on 15 Aug 2018
+1
 aramhakobyan
on 28 Aug 2018
aramhakobyan
on 28 Aug 2018
+1
Any plans for the near future?
 tammytankian
on 25 Sep 2018
tammytankian
on 25 Sep 2018
+1
 shahrzaadpeyman
on 10 Oct 2018
shahrzaadpeyman
on 10 Oct 2018
+1
 saadsarfrazz
on 25 Oct 2018
saadsarfrazz
on 25 Oct 2018
Hey, @nthienan @kccheung
We've fixed a few bugs
Now multibar-panel is working in Grafana 5+
 rozetko
on 25 Oct 2018
rozetko
on 25 Oct 2018
+1 for this feature
 cby016
on 11 Dec 2018
cby016
on 11 Dec 2018
+1
 bmfmsd
on 20 Dec 2018
bmfmsd
on 20 Dec 2018
+1
 zuzya
on 16 Jan 2019
zuzya
on 16 Jan 2019
Hi @rozetko, looks like multibar-panel has exactly what I am looking for as well.
I'd like to use a 7day bar graph to show daily Energy Usage and Production (solar).
Any news on integrating this a plugin? I use graphana as an addon on hass.io and do not think I am able to manually add stuff via commandline with my implementation.
 heldopsokken
on 20 Jan 2019
heldopsokken
on 20 Jan 2019
+1
 maxdraki
on 23 Jan 2019
maxdraki
on 23 Jan 2019
+1
 Paul-Reed
on 28 Jan 2019
Paul-Reed
on 28 Jan 2019
+1
 alexslo
on 11 Feb 2019
alexslo
on 11 Feb 2019
+1
 mboogert
on 12 Feb 2019
mboogert
on 12 Feb 2019
Just piling on to support the concept of a multi-bar chart with side by side bars.
 arriflex
on 14 Feb 2019
arriflex
on 14 Feb 2019
This would be essential feature. So +1 for this request
 AbyssCoreInc
on 1 Mar 2019
AbyssCoreInc
on 1 Mar 2019
This is how you +1 for this feature request:

Just click the 👍 on the first post
 CWempe
on 1 Mar 2019
CWempe
on 1 Mar 2019
+1
 bingobook02
on 21 Mar 2019
bingobook02
on 21 Mar 2019
Would be a handy feature, the idea could be as simple as grouping by alias, for my use case grouping dots under the same alias.

bingobook02
on 21 Mar 2019
+1
For grafana 6
 ceinmart
on 22 Mar 2019
ceinmart
on 22 Mar 2019
+1
For grafana 6
@ceinmart Please add a thumbs up to the first post in the thread, and that will make 100 users requesting this enhancement.
Paul-Reed
on 22 Mar 2019
Hi,
someone could help me to install the plugin https://github.com/CorpGlory/grafana-multibar-graph-panel.
I searched with command "grafana-cli plugins" but without succes i guess it must be installed manually but does not know how to achieveit.
 elkekou
on 5 Apr 2019
elkekou
on 5 Apr 2019
+1 please (thumbed-up on OP too)
 RedSpid3r
on 8 Apr 2019
RedSpid3r
on 8 Apr 2019
@elkekou
Hi,
someone could help me to install the plugin https://github.com/CorpGlory/grafana-multibar-graph-panel.
I searched with command "grafana-cli plugins" but without succes i guess it must be installed manually but does not know how to achieveit.
Just download the archive from github (releases) and unpack it to Grafana's plugin folder. After a restart of Grafana the plugin is available.
 JensLederer
on 2 May 2019
JensLederer
on 2 May 2019
Hi , I have problem with bar charts beside each other , all of my items gather in one bars as in thew picture , also i applied stack but no difference.
 bahmanfarid
on 17 Jun 2019
bahmanfarid
on 17 Jun 2019
+1
 Optimusbumble
on 12 Jul 2019
Optimusbumble
on 12 Jul 2019
+1111111
 LOADCRCHS
on 1 Aug 2019
LOADCRCHS
on 1 Aug 2019
+1
 lester289
on 5 Aug 2019
lester289
on 5 Aug 2019
Can anyone say A) if and B) when the Multibar Graph Panel may be promotoed to become an official plugin or even better a native plugin that comes with an new release of grafana automatically?
 Robosoc11
on 14 Nov 2019
Robosoc11
on 14 Nov 2019
Can anyone say A) if and B) when the
Multibar Graph Panelmay be promotoed to become an official plugin or even better a native plugin that comes with an new release of grafana automatically?
I had a talk with a Grafana sales guy earlier this year. Asked him why they don't add this functionality to the native graph panel plugin. He told me that there are other things that have much higher priority, than adding this feature to the graph panel.
I don't know if this statement has deprecated in between.
JensLederer
on 14 Nov 2019
I had a talk with a Grafana sales guy earlier this year. Asked him why they don't add this functionality to the native graph panel plugin. He told me that there are other things that have much higher priority, than adding this feature to the graph panel.
I don't know if this statement has deprecated in between.
Thank's Jens
Robosoc11
on 14 Nov 2019
I found a plugin to achieve the same results,
https://github.com/gipong/grafana-groupedbarchart-panel
source: https://community.grafana.com/t/monthly-grouped-bar-chart/27198
 hassanfarid
on 20 Mar 2020
hassanfarid
on 20 Mar 2020
+1
 truj
on 18 Nov 2020
truj
on 18 Nov 2020
Related issues
 german-bortoli
·
95Comments
german-bortoli
·
95Comments
 sanchitraizada
·
126Comments
torkelo
·
90Comments
sanchitraizada
·
126Comments
torkelo
·
90Comments
 mbell697
·
145Comments
mbell697
·
145Comments
 darox
·
105Comments
darox
·
105Comments
Most helpful comment
I've been briefly looking at this and it should be quite easy with jquery.flot.orderBars plugin.
The only a bit more complicated thing would be calculating the bars width.