I'm running the latest version of grafana on two instances, but I'm facing a lot of unauthorized errors when trying to access both instances. For auth I'm currently using the built-in db, no LDAP. The data source is an influxdb.
Is this a known bug or misbehaviour?
 darox
darox
All 105 comments
Could you give some more details:
- Are these two separate instances?
- What action triggers the unauthorized error?
- Are you getting logged out or it is just certain actions that do no work?
 daniellee
on 2 Feb 2018
daniellee
on 2 Feb 2018
Are they setup on different ips/domain names? if the domain name is the same and only different by port you need to have unique session cookies and remember me cookies
 torkelo
on 2 Feb 2018
torkelo
on 2 Feb 2018
-Those are seperate instances
-I don't know which action triggers the unauthorized, it just happens when I watch graphs or when accessing grafana
-Sometimes I get logged out
-Seperate domains
darox
on 2 Feb 2018
I'm encountering this on Grafana 4.6.x with oauth through Github. It's seemingly random when I switch tabs and come back to Grafana. A refresh will "correct" the issue, but it sometimes comes back later on.
 pgporada
on 7 Mar 2018
pgporada
on 7 Mar 2018

I see the same issue on Grafana v4.6.2 (commit: 8db5f08), everything works as expected, and the suddenly I receive an Unauthorized warning (and some graphs are emtpy, but some show up normally).
I use Prometheus as the DataSource.
I also think this mainly happens when the dashboard is auto-refreshed, but fixes itself when I refresh it manually.
 ajardan
on 8 Mar 2018
ajardan
on 8 Mar 2018
Similar issue here too, but with a single Grafana instance with HTTPS, and Postgres datasource.
When the dashboard is opened, all graphs are good. But sometimes after, some of the graphs starts showing "Unauthorized" errors upon auto-refresh, but within the next (or next few) auto-refresh they recover to normal state, but then turns into "Unauthorized" state sometimes later again, repeating this random behavior on each auto-refresh.
Not sure if it's related, but found the following log messages.
lvl=eror msg="Failed to get user with id" logger=context userId=1 error="User not found"
Grafana version is as follows:
lvl=info msg="Starting Grafana" logger=server version=5.0.4 commit=7dc36ae compiled=2018-03-28T20:52:41+0900
I'm using Firefox, and I usually leave the dashboard open & untouched for multiple days, with the client machine (not the server machine hosting Grafana) going into sleep mode from time to time.
 after-the-sunrise
on 12 Apr 2018
after-the-sunrise
on 12 Apr 2018
This is not happening to me anymore with grafana 5.x
darox
on 12 Apr 2018
I'm still having this exact same issue with Grafana 5.0.4, same messages of user not found in the log (this is with a simple local Grafana user).
 SoulSeekkor
on 13 Apr 2018
SoulSeekkor
on 13 Apr 2018
I'm having this issue, too. And the issue is very interesting. It may happens when I open two grafana pages of different version in the same browser and trying to do some operations.
I have an older version of grafana(v4.3.2 (commit: ed4d170)) and has run well on grafana.mydomain.com for a long time. Today I want to upgrade my grafana to v5.0.4. Instead of upgrade in place. I wanted to setup the new Grafana on the same machine, copy the dashboard I want , and then tear the old one down.
So what I did:
- docker run grafana5 on the same machine of the old one with port map to 3005
- opened the old grafana4 on
grafana.mydomain.comin Safari
And it works well - visit Grafana5 on
grafana.mydomain.com:3005in Safari
So now I have two opened tab of Grafana4 and Grafana5 on my screen - login Grafana5, trying to do some operations .... like [create dashboard]
Now both Grafana page crashed
Both Grafana will get Unauthorized errors and get no data points
Update: I changed my step 3 by visiting Grafana5 with [ip]:3005. It works fine for now.
It looks like there may be some conflicts opening two Grafana pages within the same domain.
 kehao95
on 18 Apr 2018
kehao95
on 18 Apr 2018
@kehao95 your use-case of in the same browser opening two Grafana instances on the same domain but with different ports is not supported. (Torkel mentioned that above).
@ajardan are your instances on the same domain or different ones?
daniellee
on 30 Apr 2018
@daniellee I actually only use one instance all the time. And graphs on the dashboard I look into are pulled from 2 different datasources (Prometheus and Cloudera)
ajardan
on 7 May 2018
I also get this strange "Unauthorized" issues from time to time. Page refresh "fixes" the problem. I run Grafana v5.1.0 (844bdc53a) from official Docker image. Datasource is InfluxDb. I created 2 organizations in Grafana, but use only one actually. Single 'admin' user.
 dogada
on 8 May 2018
dogada
on 8 May 2018
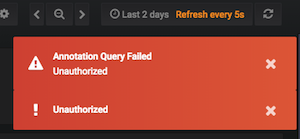
Just got this error one more time with a new error message "Annotation query failed. Unauthorized"
dogada
on 8 May 2018
My grafana on win10 x64 was working perfectly fine for a couple of days until I receive a warning "Unauthorized". The behavior is the same as described by @dogada and I'm also running v5.1.0 with influxdb. Both grafana and influxdb are on the same computer.
 schwarzlowe
on 9 May 2018
schwarzlowe
on 9 May 2018
Same issue. One grafana 5.1 instance in docker. Google oauth for authorization.
Any updates?
 StupidScience
on 11 May 2018
StupidScience
on 11 May 2018
Same behavior. Currently running v5.0.3 in docker, internal auth, single admin user, proxied via nginx, datasource is influxdb. Dashboard fixes itself when auto-refresh data. Mostly happens when tab long time in background
 radium88
on 15 May 2018
radium88
on 15 May 2018
Same issue seen when having two tabs open to the same instance.
 lamoni
on 15 May 2018
lamoni
on 15 May 2018
Update to latest docker image v5.1.2 (commit: c3c690e21) doesn't fixed issue
radium88
on 16 May 2018
I'm having what I believe to be the same issue with Grafana 5.0.0 in Docker using GitHub OAuth. I've seen it on dashboards with InfluxDB, CloudWatch, and a mixture of both datasources. (One instance, one port, HTTPS, behind an ELB.)
Like others in this thread, I seem to see it triggered by an auto-refresh, and it goes away after a page reload. Sometimes I see the basic "Unauthorized" error message (with graph loading failures) and sometimes (more rarely) the "Annotation query failed. Unauthorized" message as well.
~My suspicion is pointing towards something with the OAuth plugins?~ It's almost definitely due to the session backend, see below.
 bjacobel
on 16 May 2018
bjacobel
on 16 May 2018
To add more detail I've found after digging in a little deeper, I see many errors like this in my logs:
t=2018-05-16T16:55:39+0000 lvl=eror msg="Failed to get user with id" logger=context userId=2 error="User not found"
The only place I see such an error thrown is in this line of code, which seems related to managing sessions and session cookies?
I'm storing my sessions using the default file backend, but via a mounted EFS share, I wonder if that is a potential complication.
bjacobel
on 16 May 2018
I Faced this issue when i try to open two different Grafana (which are Running in Different port )in the same browser.
I get Unauthorized Errors and Sometimes get logged out
 harshitha-m
on 23 May 2018
harshitha-m
on 23 May 2018
It would be really interesting to see what SQL queries are executed when you receive the Failed to get user with id log message. If you easily can reproduce this it would be super valuable if you could enable logging of sql queries and report back your findings:
[database]
# Set to true to log the sql calls and execution times.
log_queries = true
Thank you
 marefr
on 30 May 2018
marefr
on 30 May 2018
@marefr It seems like these errors always occur surrounded by one of these two queries:
SELECT\n\t\tu.id as user_id,\n\t\tu.is_admin as is_grafana_admin,\n\t\tu.email as email,\n\t\tu.login as login,\n\t\tu.name as name,\n\t\tu.help_flags1 as help_flags1,\n\t\tu.last_seen_at as last_seen_at,\n\t\t(SELECT COUNT(*) FROM org_user where org_user.user_id = u.id) as org_count,\n\t\torg.name as org_name,\n\t\torg_user.role as org_role,\n\t\torg.id as org_id\n\t\tFROM `user` as u\n\t\tLEFT OUTER JOIN org_user on org_user.org_id = 1 and org_user.user_id = u.id\n\t\tLEFT OUTER JOIN org on org.id = org_user.org_id WHERE u.id=? []interface
UPDATE `user` SET `last_seen_at` = ? WHERE `id`=? []interface
Full example logs:
t=2018-05-30T15:59:39+0000 lvl=info msg="[SQL] SELECT\n\t\tu.id as user_id,\n\t\tu.is_admin as is_grafana_admin,\n\t\tu.email as email,\n\t\tu.login as login,\n\t\tu.name as name,\n\t\tu.help_flags1 as help_flags1,\n\t\tu.last_seen_at as last_seen_at,\n\t\t(SELECT COUNT(*) FROM org_user where org_user.user_id = u.id) as org_count,\n\t\torg.name as org_name,\n\t\torg_user.role as org_role,\n\t\torg.id as org_id\n\t\tFROM `user` as u\n\t\tLEFT OUTER JOIN org_user on org_user.org_id = 1 and org_user.user_id = u.id\n\t\tLEFT OUTER JOIN org on org.id = org_user.org_id WHERE u.id=? []interface
{}
{2} - took: 54.517418ms" logger=sqlstore.xorm
t=2018-05-30T15:59:39+0000 lvl=info msg="[SQL] UPDATE `user` SET `last_seen_at` = ? WHERE `id`=? []interface
{}
{\"2018-05-30 15:59:39\", 2} - took: 42.957209ms" logger=sqlstore.xorm
t=2018-05-30T15:59:39+0000 lvl=eror msg="Failed to get user with id" logger=context userId=2 error="User not found"
t=2018-05-30T15:59:39+0000 lvl=info msg="[SQL] SELECT\n\t\tu.id as user_id,\n\t\tu.is_admin as is_grafana_admin,\n\t\tu.email as email,\n\t\tu.login as login,\n\t\tu.name as name,\n\t\tu.help_flags1 as help_flags1,\n\t\tu.last_seen_at as last_seen_at,\n\t\t(SELECT COUNT(*) FROM org_user where org_user.user_id = u.id) as org_count,\n\t\torg.name as org_name,\n\t\torg_user.role as org_role,\n\t\torg.id as org_id\n\t\tFROM `user` as u\n\t\tLEFT OUTER JOIN org_user on org_user.org_id = 1 and org_user.user_id = u.id\n\t\tLEFT OUTER JOIN org on org.id = org_user.org_id WHERE u.id=? []interface
{}
{2} - took: 69.013955ms" logger=sqlstore.xorm
t=2018-05-30T15:59:39+0000 lvl=info msg="[SQL] UPDATE `user` SET `last_seen_at` = ? WHERE `id`=? []interface
{}
{\"2018-05-30 15:59:39\", 2} - took: 5.593997ms" logger=sqlstore.xorm
t=2018-05-30T15:59:39+0000 lvl=eror msg="Failed to get user with id" logger=context userId=2 error="User not found"
t=2018-05-30T15:59:39+0000 lvl=eror msg="Failed to get user with id" logger=context userId=2 error="User not found"
t=2018-05-30T15:59:39+0000 lvl=info msg="[SQL] UPDATE `user` SET `last_seen_at` = ? WHERE `id`=? []interface
{}
{\"2018-05-30 15:59:39\", 2} - took: 46.673µs" logger=sqlstore.xorm
t=2018-05-30T15:59:39+0000 lvl=eror msg="Failed to get user with id" logger=context userId=2 error="User not found"
t=2018-05-30T15:59:39+0000 lvl=eror msg="Failed to get user with id" logger=context userId=2 error="User not found"
t=2018-05-30T15:59:39+0000 lvl=info msg="[SQL] UPDATE `user` SET `last_seen_at` = ? WHERE `id`=? []interface
{}
{\"2018-05-30 15:59:39\", 2} - took: 621.538µs" logger=sqlstore.xorm
Thanks a lot @bjacobel. Everything looks good here according to me. There's an actual user id provided all the way down to the database query. Really strange. Starting to think there's a bug with our 3rd party database lib xorm.
Did you do anything specific to generate those log messages?
What database are you using? What session storage?
What request is resulting in unauthorized, you can enable router logging to log all requests:
[server]
router_logging = true
We have the same error on 5.1.4 in Kubernetes.
 benkeil
on 21 Jun 2018
benkeil
on 21 Jun 2018
Hi @marefr, sorry, I forgot to respond with the additional requested detail.
Did you do anything specific to generate those log messages?
The queries are generated by loading a dashboard and then waiting for an auto-refresh. It doesn't happen on every auto-refresh, and sometimes it can trigger with a manual click of the dashboard refresh button (the one built into Grafana, not the browser refresh button) but generally it seems to happen more often when the user is inactive (leaving grafana in a background tab, for example.)
What database are you using? What session storage?
The database is SQLite on a mounted NFS (EFS) share, and the session storage is the default (file), although I have also tried the memory-based storage and it also had the same issue. We have one grafana host behind a load balancer, and I've enabled session stickiness on that load balancer.
What request is resulting in unauthorized?
I didn't enable router logging, because I can see the request that is resulting in unauthorized from the browser:
[Some sensitive information redacted]
Request URL: https://[my grafana hostname]/api/tsdb/query
Request Method: POST
Status Code: 401
Remote Address: [my load balancer IP]:443
Referrer Policy: no-referrer-when-downgrade
:authority: [my grafana hostname]
:method: POST
:path: /api/tsdb/query
:scheme: https
accept: application/json, text/plain, */*
accept-encoding: gzip, deflate, br
accept-language: en-US,en;q=0.9
cache-control: no-cache
content-length: 478
content-type: application/json;charset=UTF-8
cookie: _ga=GA1.2.1782868908.1520436196; __gads=ID=b1c7d78e4fd8b9fb:T=1520436200:S=ALNI_MYT2aRMJqYtHY-CkgaPWmuNtsGEtA; sailthru_hid=919b24e8c99698a8b1829b81eda7135a5956a753dd4c29265f8b45b3a11fb749fc11562ad2abbb1220b9ef37; grafana_sess=[16-char hexadecimal session string]; AWSALB=IUyH6LlTXI/TJlteL8pr838fC7nsvth7s63o5WzqOa6wsCPRpHg20vYurCrYpbIWci27fQtzQpoRxVlIc8Ud/rEPIJvqWvT21an4e9aQmZioTEAFHA3+iWv7bPHs
dnt: 1
origin: https://[my grafana hostname]
pragma: no-cache
referer: https://[my grafana hostname]/d/[dashboard path]?refresh=5m&orgId=1&from=now-1h&to=now
user-agent: Mozilla/5.0 (Macintosh; Intel Mac OS X 10_12_6) AppleWebKit/537.36 (KHTML, like Gecko) Chrome/67.0.3396.87 Safari/537.36
x-grafana-org-id: 1
Hi @marefr, sorry, I forgot to respond with the additional requested detail. ...
@bjacobel this is likely unrelated to the specific issue, however SQLite’s developers recommend not running SQLite over NFS. Specifically, the Grafana process should not access the DB over an NFS mount, and running from any networked file system without strong file lock support is not recommended.
On a side note, we use SQLite with session storage as you do, but on local file system. We have not experienced this same issue.
We have also tweaked the SQLite config in grafana to use WAL mode (of which I’ll eventually do a PR) for better performance.
Sent with GitHawk
 davewat
on 24 Jun 2018
davewat
on 24 Jun 2018
I'm having the same issue in my docker Grafana and InfluxDB stack.
Grafana v5.1.3 (commit: 087143285)
InfluxDB 1.5.3
Grafana is using local storage via docker volumes with sqlite database. Volumes are using local SSD.
I get the error every time I leave the tab for more then a few minutes. If I leave dev tools up in Firefox I see:
GET http://x.x.x.x:3000/api/datasources/proxy/1/query?db=(Redacted info)
{"message":"Unauthorized"}
Any sort of refresh clears the errors.
 isclever
on 25 Jun 2018
isclever
on 25 Jun 2018
I came across the same issue. For me it was related to missing the "session_provider=memcahched"
You can refer to http://docs.grafana.org/installation/configuration/#provider-config for more config options
 nikskiz
on 11 Jul 2018
nikskiz
on 11 Jul 2018
Same issue is here too. My docker setup is:
FROM grafana/grafana:5.1.0
FROM influxdb:1.5.3
 BentCoder
on 13 Jul 2018
BentCoder
on 13 Jul 2018
Closing this as it seems to be setup/config related
torkelo
on 13 Jul 2018
@torkelo Is there an obvious solution to this issue? Or a hint to help work out what might be the possible solution?
BentCoder
on 13 Jul 2018
Make sure session setup is working for HA setup or sticky sessions in load balancer is working
torkelo
on 13 Jul 2018
I don't use load balancer though.
BentCoder
on 17 Jul 2018
Same issue here without multiple replicas
Just got a 401 error on /api/login/ping sometimes randomly
 WTFKr0
on 25 Jul 2018
WTFKr0
on 25 Jul 2018
Same issue here (for years, before the 5.0 days), SQLite on ext4, single replica on Kubernetes. Latest official Docker image.
Requests fail randomly when having Grafana refresh automatically, eventually all widgets stop reporting anything. Relevant logs:
t=2018-07-31T01:38:04+0000 lvl=eror msg="Failed to get user with id" logger=context userId=2 error="User not found"
t=2018-07-31T01:38:04+0000 lvl=eror msg="Failed to get user with id" logger=context userId=2 error="User not found"
t=2018-07-31T01:38:04+0000 lvl=eror msg="Failed to get user with id" logger=context userId=2 error="User not found"
t=2018-07-31T01:38:04+0000 lvl=info msg="Request Completed" logger=context userId=0 orgId=0 uname= method=GET path=/api/datasources/proxy/4/query status=401 remote_addr=192.168.1.72 time_ms=28 size=26 referer="REDACTED"
I'll try to do some debugging, I'm 99% sure this is a Grafana (or one of its libraries) bug.
/cc @torkelo
 lorenz
on 31 Jul 2018
lorenz
on 31 Jul 2018
I'm 95% sure that this is a missing retry in case the SQLite table is locked. I'll deploy a fix locally and PR if it works.
EDIT: Scratch that, that would take a different codepath.
lorenz
on 31 Jul 2018
Here is an example error from me.
grafana_1   | t=2018-07-31T09:23:06+0100 lvl=eror msg="Failed to get user with id" logger=context userId=1 error="User not found"
grafana_1   | t=2018-07-31T09:23:06+0100 lvl=info msg="Request Completed" logger=context userId=0 orgId=0 uname= method=GET path=/api/login/ping status=401 remote_addr=192.168.33.1 time_ms=35 size=26 referer="http://192.168.33.10:3000/d/ZJ65a0Dmz/yowyow?refresh=5s&orgId=1&from=now-30d&to=now"
grafana_1   | t=2018-07-31T09:23:06+0100 lvl=info msg="Database table locked, sleeping then retrying" logger=sqlstore retry=0
grafana_1   | t=2018-07-31T09:23:06+0100 lvl=info msg="Request Completed" logger=context userId=1 orgId=1 uname=admin method=GET path=/api/login/ping status=401 remote_addr=192.168.33.1 time_ms=24 size=26 referer="http://192.168.33.10:3000/d/ZJ65a0Dmz/yowyow?refresh=5s&orgId=1&from=now-30d&to=now"
I let it run overnight to generate some more failures and am sure that it is nothing with the sessions. It's in the ORM layer, specifically in user.go GetSignedInUser() where that layer sometimes doesn't return a correct response. I recorded all requests on a fat 50 graph dashboard at 1min over one night and saw a very random pattern with clustered errors, everything points towards some concurrency / racing issue. I'm currently running a patch which propagates errors from the row reader properly (the primary candidate for this issue), I'll see if I get a different error message.
lorenz
on 31 Jul 2018
That was quick. With my error propagation patch applied I found the root cause:
t=2018-07-31T17:26:46+0000 lvl=eror msg="Failed to get user with id" logger=context userId=2 error="database table is locked"
Retries are incorrectly implemented somewhere in the SQLite execution driver.
lorenz
on 31 Jul 2018
I looked into it some more and there are multiple problems here:
- go-sqlite is not known to be goroutine-safe (which makes this whole thing with a central xorm-managed connection possibly a bad idea).
- SQLite does not support concurrent queries on a single "connection". We'd need to get xorm to open multiple connections to SQLite. Otherwise we might run into deadlocks or these locking errors since SQLite will not try to resolve locks if they are from the same connection.
I've seen people do multiple things to avoid these SQLite issues, including wrapping all SQLite access in a single mutex and opening a new SQLite instance per request. The easiest thing to do is probably to hack go-sqlite3 to contain a mutex per "connection" and just serialize all access to it (EDIT: Just realized this probably won't work since the locks show up when reading from a cursor, which you can't lock on without risking deadlocks). That's the way a C program would do it (which SQLite was made for). It might be slow, but people who need the performance should go to PostgreSQL anyways.
lorenz
on 31 Jul 2018
Thanks so much, @lorenz, for digging into this. Your indication that this is likely caused by something at the sqlite level prompted me to move our instance's config database from SQLite to Postgres (and to put our sessions in Postgres as well, which had previously been file-backed). It's not conclusive proof, but I haven't seen the Unauthorized issues since.
For others interested in trying this workaround, I used pgloader with the default settings and dropped no session or user data during the migration.
bjacobel
on 3 Aug 2018
The issue is definitely only with the SQLite backend since the "bigger" databases all have MVCC which solves this problem. I personally also moved my production instances to PostgreSQL. The issue still remains is if and how we should solve this for the SQLite backend. I see no easy way of doing that since Grafana (due to being written in Go) makes heavy use of concurrency which requires special care in SQLite beyond what Xorm currently provides.
There are already a bunch of locks and retries in the code that try to work around that, but they are inadequate. Since I've fixed the error handling for the row reader (which currently silently swallows locking errors and thus creates unpredictable behavior, I'll PR the fix soon) I've seen the locking errors show up at many more places than just the data source proxy, it's just the endpoint that's hit most often and due to the probabilistic nature of the bug makes it the most user-visible one. As far as I can see all fixes to this require hacking Xorm or go-sqlite3, which is generally not desirable.
lorenz
on 3 Aug 2018
Thanks for the great analysis @lorenz! Do you think returning 500 in this case would be a reasonable short-term workaround? As it is right now, 401 forces the browser (at least Chrome) to forget the password and requires my users to type it again. Sometimes it has to be typed multiple times until the password is finally accepted.
My current workaround is to run the database from tmpfs. It reduces the frequency of this issue, but it still happens from time to time.
 kichik
on 11 Aug 2018
kichik
on 11 Aug 2018
@kichik When I have PR'ed my change to the error handling we could think about returning HTTP 500 (or 503). But the only good workaround I can see is using an actual MVCC-capable database like PostgreSQL or MySQL which don't exhibit the issue at all. As I explained in my previous comment this issue goes further than just data requests, so returning another error code than HTTP 401 just for those will not fix the issue entirely.
lorenz
on 11 Aug 2018
I just PRed my error reporting changes in #13007, this should help people to see if they are affected by the locking issue or if it is something unrelated.
lorenz
on 22 Aug 2018
@torkelo Could we reopen this since it is clearly an issue with Grafana?
lorenz
on 22 Aug 2018
Definitely happens on a single tab (and a single user) for me.
Also using sqlite3. Interestingly, I didn't have this problem before. Now that I've added a few heavy (query wise) panels I frequently get this error, usually only for one of my heavy panels.
 Argon-
on 29 Aug 2018
Argon-
on 29 Aug 2018
Confirming that switching to a non-sqlite3 DB fixes the issue for me. I was getting with a single user and a single tab as well, with heavier/busier panels behaving worse, as well.
Update: sessions must be switched to be stored in the separate db for the complete fix.
 astral303
on 29 Aug 2018
astral303
on 29 Aug 2018
I am using mysqldb facing the same issue. Grafana version 5.2.3 , Enabled stickiness in Lb level but issue is still there.
 vishksaj
on 5 Sep 2018
vishksaj
on 5 Sep 2018
Also experiencing this, using sqlite as data backend but redis as session store on grafana 5.2.3
Approximately 150 organisations configured. Unauthorized warning pops up on internal refresh but is usually gone on manual refresh.
Getting this in the logs from time to time:
t=2018-09-22T18:10:17+0000 lvl=info msg="Database table locked, sleeping then retrying" logger=sqlstore retry=0
t=2018-09-22T18:10:17+0000 lvl=info msg="Database table locked, sleeping then retrying" logger=sqlstore retry=0
t=2018-09-22T18:10:17+0000 lvl=info msg="Database table locked, sleeping then retrying" logger=sqlstore retry=0
t=2018-09-22T18:10:17+0000 lvl=info msg="Database table locked, sleeping then retrying" logger=sqlstore retry=0
t=2018-09-22T18:10:17+0000 lvl=info msg="Database table locked, sleeping then retrying" logger=sqlstore retry=1
t=2018-09-22T18:10:17+0000 lvl=info msg="Database table locked, sleeping then retrying" logger=sqlstore retry=1
 reinhard-brandstaedter
on 12 Sep 2018
reinhard-brandstaedter
on 12 Sep 2018
This issue may cause by the mysql connection lost. When I lower the max_idle_conn and conn_max_lifetime value, this not happen again. Hope this help
 xiaochai
on 11 Oct 2018
xiaochai
on 11 Oct 2018
@vishksaj @xiaochai This is very likely a different issue, could you open a new one?
lorenz
on 11 Oct 2018
https://github.com/oleh-ozimok/grafana/commit/b19e416549553f582dccfbcaa3f4d3f1a742a462 - solved my problem ( image with hotfix docker pull olegozimok/grafana:5.3.2 )
 oleh-ozimok
on 29 Oct 2018
oleh-ozimok
on 29 Oct 2018
Grafana 5.3.2. HA configuration: 2 Grafana Instances, MySQL main DB, 2 instances of memcached for sessions, grafana dir and DB are stored on NFS. The same "Unauthorized" errors all the time, unpredictably. The same was when DB was SQLite on NFS.
 dev-e
on 1 Nov 2018
dev-e
on 1 Nov 2018
Same problem as @dev-e but simpler setup. Grafana 5.3.2, single instance, InfluxDB on the same host, single organization, single user. The message appears randomly and disappears on the next page refresh.
 luizfzs
on 1 Nov 2018
luizfzs
on 1 Nov 2018
I have the same problem. Randomly getting Unauthorized errors.
Upgrading to grafana 5.3.4 kinda made it better, but still quite many errors.
In grafana logs:
t=2018-11-19T09:55:07+0200 lvl=eror msg="Failed to get user with id" logger=context userId=1 error="User not found"
t=2018-11-19T09:55:07+0200 lvl=eror msg="Failed to get user with id" logger=context userId=1 error="User not found"
t=2018-11-19T09:55:07+0200 lvl=eror msg="Failed to get user with id" logger=context userId=1 error="User not found"
Out of the box setup:
grafana/now 5.3.4 amd64
influxdb/now 1.6.0-1 amd64
 gigake
on 19 Nov 2018
gigake
on 19 Nov 2018
Same problem here:
t=2018-12-03T09:28:21+0000 lvl=eror msg="Failed to update last_seen_at" logger=context userId=12 orgId=1 uname=ht error="database table is locked"
t=2018-12-03T10:02:03+0000 lvl=eror msg="Failed to get user with id" logger=context userId=12 error="User not found"
t=2018-12-03T10:02:03+0000 lvl=eror msg="Failed to get user with id" logger=context userId=12 error="User not found"
t=2018-12-03T10:02:03+0000 lvl=eror msg="Failed to get user with id" logger=context userId=12 error="User not found"
t=2018-12-03T10:02:03+0000 lvl=eror msg="Failed to get user with id" logger=context userId=12 error="User not found"
t=2018-12-03T10:46:54+0000 lvl=eror msg="Failed to get user with id" logger=context userId=3 error="User not found"
t=2018-12-03T10:46:54+0000 lvl=eror msg="Failed to get user with id" logger=context userId=3 error="User not found"
t=2018-12-03T10:46:54+0000 lvl=eror msg="Failed to get user with id" logger=context userId=3 error="User not found"
t=2018-12-03T10:46:54+0000 lvl=eror msg="Failed to get user with id" logger=context userId=3 error="User not found"
t=2018-12-03T10:46:54+0000 lvl=eror msg="Failed to get user with id" logger=context userId=3 error="User not found"
t=2018-12-03T10:46:54+0000 lvl=eror msg="Failed to get user with id" logger=context userId=3 error="User not found"
t=2018-12-03T10:46:54+0000 lvl=eror msg="Failed to get user with id" logger=context userId=3 error="User not found"
t=2018-12-03T10:46:54+0000 lvl=eror msg="Failed to get user with id" logger=context userId=3 error="User not found"
2018/12/03 10:51:54 http: proxy error: unexpected EOF
2018/12/03 10:51:54 http: proxy error: unexpected EOF
2018/12/03 10:51:54 http: proxy error: unexpected EOF
t=2018-12-03T10:51:55+0000 lvl=eror msg="Failed to get user with id" logger=context userId=3 error="User not found"
t=2018-12-03T10:51:55+0000 lvl=eror msg="Failed to get user with id" logger=context userId=3 error="User not found"
t=2018-12-03T10:51:55+0000 lvl=eror msg="Failed to get user with id" logger=context userId=3 error="User not found"
t=2018-12-03T10:51:55+0000 lvl=eror msg="Failed to get user with id" logger=context userId=3 error="User not found"
t=2018-12-03T10:51:56+0000 lvl=eror msg="Failed to get user with id" logger=context userId=3 error="User not found"
t=2018-12-03T10:51:56+0000 lvl=eror msg="Failed to get user with id" logger=context userId=3 error="User not found"
t=2018-12-03T10:52:25+0000 lvl=eror msg="Failed to get user with id" logger=context userId=17 error="User not found"
t=2018-12-03T10:52:25+0000 lvl=eror msg="Failed to get user with id" logger=context userId=17 error="User not found"
t=2018-12-03T10:52:25+0000 lvl=eror msg="Failed to get user with id" logger=context userId=17 error="User not found"
t=2018-12-03T10:52:25+0000 lvl=eror msg="Failed to get user with id" logger=context userId=17 error="User not found"
t=2018-12-03T10:52:25+0000 lvl=eror msg="Failed to get user with id" logger=context userId=17 error="User not found"
t=2018-12-03T10:52:25+0000 lvl=eror msg="Failed to get user with id" logger=context userId=17 error="User not found"
t=2018-12-03T10:52:25+0000 lvl=eror msg="Failed to get user with id" logger=context userId=17 error="User not found"
t=2018-12-03T10:52:25+0000 lvl=eror msg="Failed to get user with id" logger=context userId=17 error="User not found"
t=2018-12-03T10:52:25+0000 lvl=eror msg="Failed to get user with id" logger=context userId=17 error="User not found"
t=2018-12-03T10:52:25+0000 lvl=eror msg="Failed to get user with id" logger=context userId=17 error="User not found"
t=2018-12-03T10:52:25+0000 lvl=eror msg="Failed to get user with id" logger=context userId=17 error="User not found"
t=2018-12-03T10:52:25+0000 lvl=eror msg="Failed to get user with id" logger=context userId=17 error="User not found"
Single Grafana 5.3.4, storage is Amazon EFS filesystem (NFS mount)
Session is set to file, data storage is sqlite ( /var/lib/grafana/grafana.db )
Grafana sits behind a HTTPS terminating LB
 roffe
on 3 Dec 2018
roffe
on 3 Dec 2018
Made a PR implementing @oleh-ozimok suggestion. Feel free to try it out. Ill try it out more once Im back home from vacation so I can have a long-running instance :)
@oleh-ozimok If you want to create an PR I'm more then happy to merge that instead of mine to give you the credit.
Btw great work @lorenz !
 bergquist
on 27 Dec 2018
bergquist
on 27 Dec 2018
This affects our deployment as well. We constantly get 401 Unauthorized errors using two Amazon Auora MySQL databases running in HA/Multi Master mode. I have verified sessions are on both databases. But even so, I pointed all instances to the same database to see if that would fix the problem and it did not. There is definitely something wrong with sessions being authenticated correctly. This even goes further with our Oauth setup. There are times where the user would login using the configured Oauth provider and it would fail to login once redirected. If they login around 2-3 times it works.
 buroa
on 26 Jan 2019
buroa
on 26 Jan 2019
That is very strange, maybe on of the servers are configured differently?
Any log details?
We are removing the need for session storage and completely rewriting how login sessions are managed in v6, so hopefully that will solve it.
torkelo
on 27 Jan 2019
@buroa any chance you can try 6.0-beta1? We have rewritten auth token and removed most session token usage (still used when using auth_proxy) completely and hope most of these issues should go away.
bergquist
on 5 Feb 2019
@bergquist updated my setup at 2019-02-01T09:58:20+0200, not happened this error for now.
 zcooler
on 5 Feb 2019
zcooler
on 5 Feb 2019
@buroa any chance you can try 6.0-beta1? We have rewritten auth token and removed most session token usage (still used when using auth_proxy) completely and hope most of these issues should go away.
I'm using the latest build: https://github.com/buroa/grafana/tree/us-iso-regions
Does this have the change needed?
buroa
on 5 Feb 2019
@buroa yes, but would still suggest you to merge in latest master since we''ve done a few changes since 6.0-beta1.
marefr
on 5 Feb 2019
Today got an error
t=2019-02-08T10:05:58+0200 lvl=info msg="failed to look up user based on cookie" logger=context error="User auth token not found"
Browser tab was not closing, just autorefreshed every hour, but pc was locked.
 QuantumProjects
on 8 Feb 2019
QuantumProjects
on 8 Feb 2019
@QuantumProjects would you mind open a new issue since this you have problem with Grafana v6.0-pre. Please provide more details about your Grafana setup: what database in use? Grafana version? Multiple Grafana instances? What authentication type? Reverse proxy? Thanks
marefr
on 8 Feb 2019
@marefr Ok
QuantumProjects
on 8 Feb 2019
@marefr i am getting the same "Unauthorized"-Popups, maybe my setup can help figuring out the issue:
- Gateway server with traefik as reverse proxy pointing to a local server which is hosting grafana
- local server with Grafana v5.4.3
- datasource is an influxdb v1.7.8 on the same local server
- how to find out the questioned authentication type? I just log in as an admin user
Note: every service is a docker container, traefik x64, grafana and influxdb arm32v7
 eiabea
on 19 Feb 2019
eiabea
on 19 Feb 2019
This happens in Grafana 6.0.0 (commit: 34a9a62, branch: HEAD) as well. SQLite database is un use, Grafana is working behind nginx reverse proxy. LDAP authentication is configured. Single Grafana instance is running on this VM.
Log entry at the time of error:
t=2019-03-06T13:39:24+0100 lvl=eror msg="failed to look up user based on cookie" logger=context error="database is locked"
 angryp
on 6 Mar 2019
angryp
on 6 Mar 2019
Just adding a data point, once I moved my db from sqlite to postgres, I stopped seeing these errors. Previously they had been frequent enough to make using the system quite uncomfortable. Running a single 5.4.3 server with google oauth.
 qhartman
on 6 Mar 2019
qhartman
on 6 Mar 2019
Happening to me on 5.4.3 connected to postgres, fairly randomly but only when I let it autorefresh. Setup is on a local network where database is on same box as Grafana.
I am getting a bunch of these types of errors on syslog at the time the "Unauthorized" pops up:
...
...
grafana-server[12619]: t=2019-03-06T22:42:02+0100 lvl=info msg="Database table locked, sleeping then retrying" logger=sqlstore retry=0
grafana-server[12619]: t=2019-03-06T22:42:03+0100 lvl=eror msg="Failed to get user with id" logger=context userId=1 error="User not found"
...
grafana-server[12619]: t=2019-03-06T22:42:03+0100 lvl=info msg="Request Completed" logger=context userId=0 orgId=0 uname= method=POST path=/api/tsdb/query status=401 remote_addr=192.168.0.2 time_ms=17 size=26 referer="http://192.168.0.1:3000/d/.....
...
There are some variations on the log on userId=1 or 0 and on retry=1 or 0
 ggggh
on 6 Mar 2019
ggggh
on 6 Mar 2019
Hello,
I had today the same problem. We have Grafana 6.0.1 on a plain Debian Stretch upgraded a few days before. Grafana connects to a load balancer (proxysql) with MariaDB 10.2 (Galera cluster) as backend (sync mode with three nodes).
We use LDAP (Windows AD) as authorization.
Log message:
lvl=eror msg="failed to look up user based on cookie" logger=context error="invalid connection"
The only thing that worked, was to use the the direct IP and not the load balancer.
 linuxmail
on 14 Mar 2019
linuxmail
on 14 Mar 2019
The only thing that worked, was to use the the direct IP and not the load balancer.
Doesn't sound like the same issue though, as ours is intermittent - maybe one of the panels in every dozen or so refreshes may fail with the error, but generally works
ggggh
on 14 Mar 2019
The same thing happening to me on 6.0.2.
From the log:
t=2019-03-23T12:04:22+0000 lvl=eror msg="failed to look up user based on cookie" logger=context error="database is locked"
and
t=2019-03-23T19:05:45+0000 lvl=eror msg="Failed to update last_seen_at" logger=context userId=1 orgId=1 uname=<username> error="database is locked"
Regular docker install with Traefik for reverse proxying.
 menteb
on 23 Mar 2019
menteb
on 23 Mar 2019
For me the same thing it's happening
version 6.02
"failed to look up user based on cookie" logger=context error="database is locked"
 tiagoalmeida10
on 28 Mar 2019
tiagoalmeida10
on 28 Mar 2019
If your getting "database is locked" with Sqlite (default) it's probably a good time to migrate to mysql/postgres since they can handle more transactions/s
bergquist
on 3 Apr 2019
@bergquist I think that's indeed the solution. Just migrated to MariaDB and I no longer get thrown out of Grafana. Tack!
menteb
on 4 Apr 2019
@bergquist I think that's indeed the solution. Just migrated to MariaDB and I no longer get thrown out of Grafana. Tack!
To clarify, that might be a solution to "Database is locked", not "Database table locked" - I'm on PostgreSQL and facing the "table lock".
ggggh
on 4 Apr 2019
Solved for me after a Raspbian upgrade which took me to Postgres 9.6 (from 9.4). Grafana still on 5.4.3
ggggh
on 25 Apr 2019
Solved for me after a Raspbian upgrade which took me to Postgres 9.6 (from 9.4). Grafana still on 5.4.3
Forget what I said...it's back. Less often, I'd say...but still happening.
ggggh
on 10 May 2019
@ggggh any solutions? It just started happening out of the blue for me!
 devanshkv
on 22 May 2019
devanshkv
on 22 May 2019
@ggggh any solutions? It just started happening out of the blue for me!
Nothing...! It cleared out with the postgres version upgrade, and seems to be coming back again, more often each day
ggggh
on 22 May 2019
@ggggh Thanks!
I've switched to Postgres, but that isn't helping either :(
devanshkv
on 22 May 2019
having the same issues using Grafana 6.2.1 and Postgress 11, but this is happening only on dashbaords I load from JSON and then try to access them.
Any updates on this?
 botzill
on 29 May 2019
botzill
on 29 May 2019
OK, I found the issue in my case. My PG had a limited number of connections and in grafana max_open_conn was not set. After I did set this option, it works OK.
botzill
on 3 Jun 2019
Same is happening for me on Grafana 6.1.6 and packaged-in SQLite DB. This problem breaks our internal dev efforts for customizing Grafana. Changing max_open_conn does not work (though I didn't expect it to since it was a fix for Postgres).
 syardumian-chc
on 10 Jun 2019
syardumian-chc
on 10 Jun 2019
The root cause of this seems to be grafana trying to connect to the
underlying DB when authenticating, but failing to do so. With SQLite, that
will happen often and at a low count of concurrent usage since SQLite locks
so aggressively. In most cases, migrating to a real RDBMS (I like postgres)
will solve the issue. It's possible it can come up again if you run into a
connection limit (or similar) problem, but that's a DB concern more than a
Grafana concern. If you're using Grafana for anything other than a demo,
you should back it with a real DB. If that DB is configured correctly for
your usage, that should solve this problem.
On Mon, Jun 10, 2019 at 11:20 AM syardumian-chc notifications@github.com
wrote:
Same is happening for me on Grafana 6.1.6 and packaged-in SQLite DB. This
problem breaks our internal dev efforts for customizing Grafana. Changing
max_open_conn does not work (though I didn't expect it to since it was a
fix for Postgres).—
You are receiving this because you are subscribed to this thread.
Reply to this email directly, view it on GitHub
https://github.com/grafana/grafana/issues/10727?email_source=notifications&email_token=AAAK6YSUDLXPF2E4436CEOTPZ2EMFA5CNFSM4EO23EH2YY3PNVWWK3TUL52HS4DFVREXG43VMVBW63LNMVXHJKTDN5WW2ZLOORPWSZGODXKQ3UY#issuecomment-500501971,
or mute the thread
https://github.com/notifications/unsubscribe-auth/AAAK6YQLR3FSCNEQR7SNEKLPZ2EMFANCNFSM4EO23EHQ
.
qhartman
on 10 Jun 2019
I've increased the connection limit and the max idle connections, but still keep hitting this issue randomly. Not just that, but dashboards which have been open for a while seem to get slower and slower to refresh, with the loading-gif evident on each panel and slowly disappearing sequentially as each panel completes loading. It's fine if I close the browser window and open a new one. I guess my dashboard has got more complex, but that doesn't explain why a fresh load of the page "fixes it".
ggggh
on 12 Jun 2019
I am getting random error too. Really do not know what is the issue. Using IP address seems fine, but with the kubeneters ingress, it shows the "annotation query failed" randomly.
 naturalbeau
on 13 Jun 2019
naturalbeau
on 13 Jun 2019
FWIW, I recently switched my ingress loadbalancer to Fabio (from Traefik) and updated Grafana (Docker image, no additional database backends) to v6.4.2, and the 401 unauthorized errors seem to have gone away when doing automatic refresh (interval set to 10 seconds, running all day). It's unlikely that switching to Fabio fixed the issue, I'm guessing it was the newer version of Grafana that helped, but I'm not 100% sure.
 kmott
on 9 Oct 2019
kmott
on 9 Oct 2019
Closing this as there are no new reports recently. if you think there still is an issue please open a new issue
torkelo
on 19 Oct 2019
I recently installed grafana on my kubernetes cluster and ran into a similar issue.
I'm using docker image grafana/grafana:6.4.3
Checking my pod logs, I found this interesting little tidbit:
t=2019-11-01T15:18:33+0000 lvl=info msg="Successful Login" logger=http.server User=--snip--
t=2019-11-01T15:19:09+0000 lvl=eror msg="Failed to look up user based on cookie" logger=context error="dial tcp: lookup postgres.databases.svc.cluster.local: no such host"
t=2019-11-01T15:19:09+0000 lvl=info msg="Request Completed" logger=context userId=0 orgId=0 uname= method=GET path=/api/datasources/proxy/1/query status=401 remote_addr=--snip-- time_ms=11 size=26 referer="https://--snip--/d/TuobtjoZz/--snip--?orgId=1&refresh=5s&from=now-12h&to=now"
DNS issues are not something I've encountered before within my cluster, but I did some googling and found this particular issue: https://github.com/kubernetes/kubernetes/issues/30215
Would it be possible for grafana to ship both alpine and non-alpine images like a lot of docker images do? Seems like that would resolve the issue.
If there's anything I can do in testing this or helping debug let me know, I'll provide information as requested.
 ikkerens
on 1 Nov 2019
ikkerens
on 1 Nov 2019
After downgrading to 6.3.6 (which isn't alpine-based) the issue disappeared entirely on my end.
ikkerens
on 2 Nov 2019
I faced the same issue , two separate Grafana (containers) open in the same browser
when login to the second the first ask me to login again , login to the first the second ask me to login again
can't keep both login
the solution I found is to change in one of the Grafana default.ini file
login_cookie_name = grafana_session
to
login_cookie_name = grafana_session_1
restart the container and the browser , now it working fine
for now I keep the file out side the container
need to set this parameter when creating the container
 n0-bs
on 20 Feb 2020
n0-bs
on 20 Feb 2020
@ikkerens please try the ubuntu based image then, 6.6.2-ununtu
marefr
on 28 Feb 2020
@n0-bs I'm sorry but if you're running multiple instances of Grafana it's suggested to use MySQL or Postgres as database.
marefr
on 28 Feb 2020
Sorry, but how , use of MySQL or Postgres as database., will solve the cookie conflict when I open these two different Grafana instances in the same browser , I'm not talking about HA case
I have two different Grafana instances (containers) on the same server
n0-bs
on 1 Mar 2020
I'm still seeing this with 6.7.2. I upgraded from 6.5 to 6.6, then 6.7. Using docker with PostgreSQL, tried 6.7.2 image then 6.7.2-ubuntu.
This is the error I'm getting in the logs:
lvl=eror msg="Failed to look up user based on cookie" logger=context error="pq: remaining connection slots are reserved for non-replication superuser connections"
 helderco
on 16 Apr 2020
helderco
on 16 Apr 2020
Fixed (at least for now) by restarting postgres.
helderco
on 16 Apr 2020
Im using the latest version of Grafana and still seeing the unauthorized issue eveytime I access it. Im using Grafana in kubernetes. I deployed it in 3 different pod in 3 different nodes. Im using the native database of it. Any suggestion to fix the isssue?
 emzfuu
on 1 Jun 2020
emzfuu
on 1 Jun 2020
@emzfuu If you run multiple instances you need to point all of them to the same database. mysql/postgres
bergquist
on 1 Jun 2020
@bergquist is there any other way to fix the issue?
emzfuu
on 2 Jun 2020
Just to elaborate my question above im using 3 different Grafana (stand alone) which is being access through single load balancer. The 3 Grafana has their own db (sqlite3). Every time I access it I receive the unauthorize error.
emzfuu
on 3 Jun 2020
I have same problem,use nfs.
 linux0x5c
on 8 Jun 2020
linux0x5c
on 8 Jun 2020
Related issues
 yuvaraj951
·
3Comments
yuvaraj951
·
3Comments
 sslupsky
·
3Comments
sslupsky
·
3Comments
 jackmeagher
·
3Comments
jackmeagher
·
3Comments
 utkarshcmu
·
3Comments
utkarshcmu
·
3Comments
 Azef1
·
3Comments
Azef1
·
3Comments
Most helpful comment
I see the same issue on Grafana v4.6.2 (commit: 8db5f08), everything works as expected, and the suddenly I receive an Unauthorized warning (and some graphs are emtpy, but some show up normally).
I use Prometheus as the DataSource.
I also think this mainly happens when the dashboard is auto-refreshed, but fixes itself when I refresh it manually.