Kibana: convert json of a kibana visualization to an elastic query
Kibana version:5.2.2
Elasticsearch version:5.2.2
Server OS version:
Browser version:
Browser OS version:
Original install method (e.g. download page, yum, from source, etc.):
for example, this is a kibina visualization json in index .kibana:
//////////////////////////////////////////////////////
{
"_index": ".kibana",
"_type": "visualization",
"_id": "08a67c30-4b43-11e7-8734-a9fa787d77b3",
"_score": 9.687088,
"_source": {
"title": "temp visualization",
"visState": """{"title":"temp visualization","type":"pie","params":{"addTooltip":true,"addLegend":true,"legendPosition":"right","isDonut":false},"aggs":[{"id":"1","enabled":true,"type":"count","schema":"metric","params":{}},{"id":"2","enabled":true,"type":"terms","schema":"segment","params":{"field":"sahab_metadata.source","size":5,"order":"desc","orderBy":"1"}}],"listeners":{}}""",
"uiStateJSON": "{}",
"description": "",
"version": 1,
"kibanaSavedObjectMeta": {
"searchSourceJSON": """{"index":"twitter","query":{"query_string":{"query":"*","analyze_wildcard":true}},"filter":[]}"""
}
}
}
////////////////////////////////////////////////////////////////
now, I need to get the elastic query of above visualization through code and programing.
the desire output is:
{
"query": {
"query_string": {
"query": "*",
"analyze_wildcard": true
}
},
"size": 0,
"_source": {
"excludes": []
},
"aggs": {
"2": {
"terms": {
"field": "sahab_metadata.source",
"size": 5,
"order": {
"_count": "desc"
}
}
}
}
}
 socialmineruser1
All 3 comments
@socialmineruser1 the spy panel should do what you want.
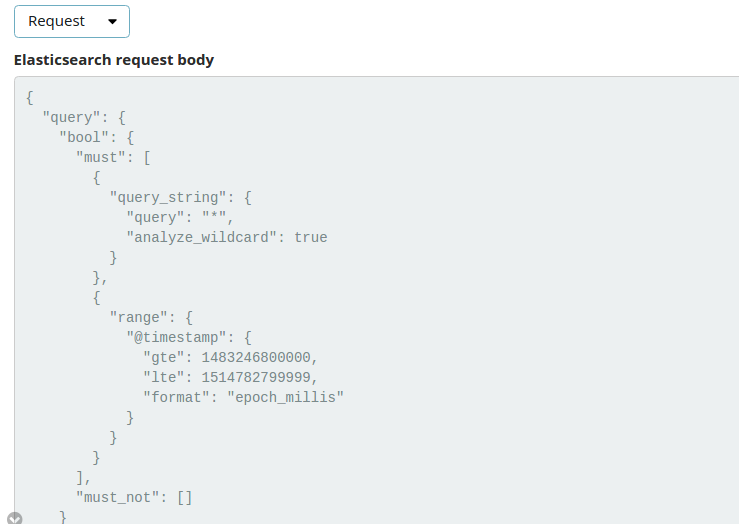
if you press the little grey-arrow-icon near the bottom of the visualization, it expands the "spy panel". This shows the ES request and response that was used to produce the visualization.
Click this:

And this will open:
 thomasneirynck
on 9 Jun 2017
thomasneirynck
on 9 Jun 2017
Thanks...
 lokeshatbigbasket
on 10 Nov 2017
lokeshatbigbasket
on 10 Nov 2017
i am not expert in Kibana but i think i can help you so visit my website
Click Here
 khanshujat
on 16 Nov 2017
khanshujat
on 16 Nov 2017
Related issues
 pkubat
·
75Comments
pkubat
·
75Comments
 rashidkpc
·
116Comments
rashidkpc
·
116Comments
 bquartier
·
79Comments
bquartier
·
79Comments
 TiNico22
·
87Comments
TiNico22
·
87Comments
 panda87
·
206Comments
panda87
·
206Comments
Most helpful comment
@socialmineruser1 the spy panel should do what you want.
if you press the little grey-arrow-icon near the bottom of the visualization, it expands the "spy panel". This shows the ES request and response that was used to produce the visualization.
Click this:

And this will open:
