Grafana: [Feature request] Add Alert support for singlestats
Please include this information:
- What Grafana version are you using?
v4.0.2 (commit: v4.0.2)
What datasource are you using?
GraphiteWhat OS are you running grafana on?
Mac OSWhat did you do?
Went to a dashboard, clicked on a single stat and expected to find the "Alert" tab.What was the expected result?
I was expecting to see the "Alert" tabWhat happened instead?
The "Alert" tab was not present for the Singlestat. It is present for Graph though.
If it relates to alerting
- An image of the test execution data fully expanded.

 costimuraru
All 162 comments
+1
 arnesund
on 28 Dec 2016
arnesund
on 28 Dec 2016
+1
 mdunnio
on 28 Dec 2016
mdunnio
on 28 Dec 2016
And tables, and the rest.
 pdf
on 14 Jan 2017
pdf
on 14 Jan 2017
+1
 buumi
on 27 Jan 2017
buumi
on 27 Jan 2017
+1 !!!!!! YES <3
 JeromeVi
on 10 Feb 2017
JeromeVi
on 10 Feb 2017
+1 as well, this would be a fantastic addition!
 Pbants
on 15 Feb 2017
Pbants
on 15 Feb 2017
+1 + alert on "If no data or all values are null" +alert "If execution error or timeout"
 varyhin
on 23 Feb 2017
varyhin
on 23 Feb 2017
+1, I want to have alerts of off/on values
 kompa3
on 28 Feb 2017
kompa3
on 28 Feb 2017
+1
 calebcall
on 28 Feb 2017
calebcall
on 28 Feb 2017
+1
Also for table.
 miniskipper
on 24 Mar 2017
miniskipper
on 24 Mar 2017
I assume the reason @pdf is downvoting the "+1" comments is because GitHub etiquette is now to upvote the main issue instead of adding "+1" comments. I've removed my comment in favour of an upvote.
 jacobtomlinson
on 24 Mar 2017
jacobtomlinson
on 24 Mar 2017
Do we have an estimated release on when this will be added? I've added my "up vote".
 erikboyer
on 24 Apr 2017
erikboyer
on 24 Apr 2017
+1
 blaketmiller
on 24 Apr 2017
blaketmiller
on 24 Apr 2017
+1
 YazovskayaO
on 6 May 2017
YazovskayaO
on 6 May 2017
Making something that should be singlestat into a graph just to add alerts is really really ugly :(
 khou
on 16 May 2017
khou
on 16 May 2017
@khou Agreed! Our current workaround is to have a second dashboard with graph versions of our single stats with alerts on.
jacobtomlinson
on 18 May 2017
+1
 vsel
on 6 Jun 2017
vsel
on 6 Jun 2017
Alerts for tables will be good too, I think, because of group by hostname, for example:)
 ketchoop
on 6 Jun 2017
ketchoop
on 6 Jun 2017
+1
 realandraja
on 20 Jun 2017
realandraja
on 20 Jun 2017
With 83+ upvotes it is surprising this isn't in the next milestone.
 playqdrew
on 21 Jun 2017
playqdrew
on 21 Jun 2017
I agree with you playqdrew...
erikboyer
on 22 Jun 2017
I've added my upvote on this as well. Alerts should be available for ALL stock panels in Grafana. After upgrading to 4.3.2, I see it's still not an option.
When can we expect this to be added to the next milestone? I see it's not on the 4.4.0 milestone.
 ceseuron
on 30 Jun 2017
ceseuron
on 30 Jun 2017
+1
 MartinGroh
on 7 Jul 2017
MartinGroh
on 7 Jul 2017
One more vote from my side. +1, would be nice to have Alerts if null r bellow certian values for the SingleStat
 joaquin386
on 10 Jul 2017
joaquin386
on 10 Jul 2017
+1
 eloo
on 10 Jul 2017
eloo
on 10 Jul 2017
Upvoted.
Alerts on a single stat would be boss, like disk space.
 tinyhammers
on 21 Jul 2017
tinyhammers
on 21 Jul 2017
I need it
 ski7777
on 21 Jul 2017
ski7777
on 21 Jul 2017
+1
 nufrix
on 27 Jul 2017
nufrix
on 27 Jul 2017
Sorry for the additional notification folks, but this is a request for a member of the Grafana GitHub org to please lock this thread to further comments until a time when it is being considered for implementation.
The number of +1 comments doesn't provide any value to the conversation but still notifies every person subscribed. A counter argument could be to tell me to unsubscribe since I don't want to receive those notifications, however I do want notifications if/when this feature is to be implemented.
Those wanting to up vote the issue please use the reactions on the original post, see https://github.com/blog/2119-add-reactions-to-pull-requests-issues-and-comments for more info.
 rowleyaj
on 27 Jul 2017
rowleyaj
on 27 Jul 2017
@bergquist can we expect this feature in 5.0?
 yesoreyeram
on 16 Jan 2018
yesoreyeram
on 16 Jan 2018
@yesoreyeram I would love to say yes but it looks like its gonna be tight.
 bergquist
on 16 Jan 2018
bergquist
on 16 Jan 2018
Downloaded beta 5.0 and it´s not on it :(
 jupklas
on 6 Feb 2018
jupklas
on 6 Feb 2018
really? It's such a requested feature yet it's still not made it in. Wow.
 glitchcrab
on 6 Feb 2018
glitchcrab
on 6 Feb 2018
This is the second most requested feature on the GitHub repo when sorted by 👍 . Real shame this isn't being treated with higher priority.
jacobtomlinson
on 6 Feb 2018
This addition is a no-brainer, guys. Hopefully it's not super hard to implement, but it's a pretty high priority issue.
 Xeyk
on 23 Feb 2018
Xeyk
on 23 Feb 2018
👍
costimuraru
on 23 Feb 2018
Hoping for this feature to be implemented ASAP
 nookalavikas
on 19 Mar 2018
nookalavikas
on 19 Mar 2018
+1 Let do that
 uncelvel
on 21 Mar 2018
uncelvel
on 21 Mar 2018
Surprised to see that alerting is not possible for single stat. Essential part! Not a nice to have, a need to have!
 mjebijma
on 21 Mar 2018
mjebijma
on 21 Mar 2018
+1
 directionsystems
on 4 Apr 2018
directionsystems
on 4 Apr 2018
+1
 pedroabi
on 5 Apr 2018
pedroabi
on 5 Apr 2018
+1
 JohnCMcDonough
on 6 Apr 2018
JohnCMcDonough
on 6 Apr 2018
Please can someone lock this thread, the number of +1 comments is getting frustrating. It is the second most 👍 issue in the repo, so it's pretty obvious how important it is to everyone and it doesn't need any more voting.
Every time I get a notification about the issue I get excited that it is actually being worked on, but then I get sad again when I just see another +1.
jacobtomlinson
on 6 Apr 2018
+1
 five-team
on 3 Jun 2018
five-team
on 3 Jun 2018
Can we not do the +1 comments pleeease??
Note: You are e-mailing hundreds of people by commenting on this issue!
If you just want to show your support and upvote this feature request, please click a "Thumbs up" reaction on costimuraru's original issue description above.
(and my apologies for this e-mail)
 johanot
on 14 Jun 2018
johanot
on 14 Jun 2018
+1
 rodolfhoalves
on 14 Jun 2018
rodolfhoalves
on 14 Jun 2018
+1
 jmolinier
on 21 Jun 2018
jmolinier
on 21 Jun 2018
Alert on singlestat is nice to have. Especially when you have dozen of servers to monitor.
 dreambeam
on 5 Jul 2018
dreambeam
on 5 Jul 2018
Unfortunately, it seems that Alerts exist only on Graphs, and if we do not have Alert on Singlestat and other panels in most of our use cases, Grafana Alerting is not well suited and we have to use another component for Alerting (like Prometheus Alertmanager)
 tiagoReichert
on 10 Jul 2018
tiagoReichert
on 10 Jul 2018
No one assigned? No Milestone? For one of the most demanded features (Alert on Singlestat)? is it really possible?
 UzLA
on 23 Jul 2018
UzLA
on 23 Jul 2018
Why such a desired feature not implemented since end of 2016? Even no comments about its status.
 KawaiDesu
on 25 Jul 2018
KawaiDesu
on 25 Jul 2018
does anyone knows a workaround ?
i tried to use graph to monitor status of a windows service and use an alert on it but it doesn't seem to work
 flenoir
on 1 Aug 2018
flenoir
on 1 Aug 2018
+1
 faulpeltz
on 1 Aug 2018
faulpeltz
on 1 Aug 2018
@flenoir The workaround we're using is to have a separate dashboard for alerting, and create numerous "Graph" Meters, and set them all to Display -> Mode -> "Single" making it like a bar chart.
We can then (finally) set an alert. I really don't like having to have a separate page with duplicated stats, but as far as I'm aware, it's the only way at the moment.....
 1n5aN1aC
on 1 Aug 2018
1n5aN1aC
on 1 Aug 2018
@flenoir If you are using Grafana together with Prometheus I recommend that you take a look on Alertmanager, it has much more alert configuration then Grafana.
tiagoReichert
on 1 Aug 2018
+1, SingleStat alert for services status(Health/Unhealthy), server status(up/down)
 dfang
on 10 Aug 2018
dfang
on 10 Aug 2018
+1 for this... no reason not to have it
 brad-plumewifi
on 11 Aug 2018
brad-plumewifi
on 11 Aug 2018
+1
 KelvinLin
on 4 Sep 2018
KelvinLin
on 4 Sep 2018
+1
 lukaszpy
on 5 Sep 2018
lukaszpy
on 5 Sep 2018
+1
 lewis-carhart
on 5 Sep 2018
lewis-carhart
on 5 Sep 2018
At this point, this issue feels like some meta-joke about the GitHub community, and I'd almost vote against locking it.
 jareware
on 6 Sep 2018
jareware
on 6 Sep 2018
I don't know whether to laugh or cry @jareware
pdf
on 6 Sep 2018
OMG, since 16.dec.2016 still no alerts available for tables and single stats...
Please, its time to add them....
 Ramalama2
on 17 Sep 2018
Ramalama2
on 17 Sep 2018
I just want to know anybody looking into this ?
 sdwivedimm
on 9 Oct 2018
sdwivedimm
on 9 Oct 2018
Graffana support looks death
 estif95
on 11 Oct 2018
estif95
on 11 Oct 2018
seems for me like the whole grafana development is dead...
We get new versions of grafana, but there are almost since 2 years not a single new feature... :-)
Cheers
Ramalama2
on 16 Oct 2018
Are you serious? There's been new features nearly every release and in the last two years, grafana has changed dramatically. Just today they released 5.3 with yet even more new features. They may not be the features you want, but to say they aren't releasing new features is just plain ignorant.
calebcall
on 16 Oct 2018
If those complaining are really concerned about not having certain features, I'd highly suggest you consider supporting the product rather than criticizing the _open source_ version.
Features that you want not coming fast enough? Sign up for Enterprise to help influence the future roadmap then. https://grafana.com/enterprise
 calebtote
on 16 Oct 2018
calebtote
on 16 Oct 2018
@calebtote , I'm using your hosted grafana cloud and I don't have this feature ! Is it normal ?
 thpham
on 17 Oct 2018
thpham
on 17 Oct 2018
+1
 FAE-MICHAEL
on 6 Nov 2018
FAE-MICHAEL
on 6 Nov 2018
Hi, I dont know if you have seen it, but they have at least planned it for future releases :)
Quote from: http://docs.grafana.org/alerting/rules/ (under Rule Config)
"Currently only the graph panel supports alert rules but this will be added to the Singlestat and Table panels as well in a future release."
 Aggerone
on 17 Nov 2018
Aggerone
on 17 Nov 2018
Would be great if the alerting system of grafana improves a bit more - everything else is awesome.
I raised a request for conditional alerts here and even this issue is very important to be solved to get the alert system right.
Btw, I just came to know from the website that Grafana 6 is to be shipped on Feb. Any plans to include this in that? Thanks.
 tvvignesh
on 18 Nov 2018
tvvignesh
on 18 Nov 2018
+1
 hamdikh
on 6 Dec 2018
hamdikh
on 6 Dec 2018
+1
 ZalemCitizen
on 21 Dec 2018
ZalemCitizen
on 21 Dec 2018
@torkelo Any news on this?
 msschl
on 2 Jan 2019
msschl
on 2 Jan 2019
+8000
 luizgustavo77
on 9 Jan 2019
luizgustavo77
on 9 Jan 2019
+1
 AliNjie
on 11 Jan 2019
AliNjie
on 11 Jan 2019
Seriously, can we just lock this please @torkelo @bergquist ?
pdf
on 11 Jan 2019
Whats the problem with implementing this?
KawaiDesu
on 11 Jan 2019
Nothing @KawaiDesu someone just needs to do it at some stage, and obviously there aren't enough resources for alerting work atm. I just want to stop the +1 spam in my inbox.
pdf
on 11 Jan 2019
+1
I would like to have support for SingleStat alert for the better view for my services status when its working and when it's not like ((Health/Unhealthy), (up/down)). Though I can achieve this with Graphs but I would like to have the high-level view for my support team :)
 esyekas
on 19 Jan 2019
esyekas
on 19 Jan 2019
+1
 goodkiller
on 23 Jan 2019
goodkiller
on 23 Jan 2019
+1
 ponchik69
on 24 Jan 2019
ponchik69
on 24 Jan 2019
+1
 anatolysergeev
on 25 Jan 2019
anatolysergeev
on 25 Jan 2019
@khou Agreed! Our current workaround is to have a second dashboard with graph versions of our single stats with alerts on.
Nice idea. One problem is clicking on the alert will navigate to secondary dashboard which is not desirable. Have you found a way to overcome this.
Also I was thinking of adding graph panels in same primary dashboard and hiding them. Is there a provision to do the same in grafana?
Thanks,
Sunil
 Sunil84
on 29 Jan 2019
Sunil84
on 29 Jan 2019
 ricsil
on 30 Jan 2019
ricsil
on 30 Jan 2019
wow, exactly what i need !
to get alerts from SingleStat and table panel :)
 kfirsh4
on 12 Feb 2019
kfirsh4
on 12 Feb 2019
+1
 fabtrompet
on 12 Feb 2019
fabtrompet
on 12 Feb 2019
+1
 niesfisch
on 6 Mar 2019
niesfisch
on 6 Mar 2019
+11111
 amrkhaledccd
on 22 Mar 2019
amrkhaledccd
on 22 Mar 2019
+1
 kotso
on 8 Apr 2019
kotso
on 8 Apr 2019
It's curious to me that this isn't on any of your road maps. I think I'm in a similar situation to a lot of others where I don't sit in a big room with monitors on the walls so we can all see the status of what we're monitoring. My team is remote and we don't have the time to sit and look at a dashboard all day. The dashboard gets checked probably in the morning and a few other times during the day but other than that we require alerts to know when it's time to look at it.
I understand that resources are scarce and it's hard to find the time to implement a feature like this. But I wanted to take the time to explain this important use-case.
I would like to convince my company to use Grafana but without the ability to alert on a singlestat or a table it's a non-starter (understand also that this would be a paid support installation for a relatively large company).
Again I know how things get prioritized and how one has to make a decision as to what is, and what is not on the roadmap. But I was surprised that I couldn't alert like this, and shocked to find that it isn't even on the roadmap. So I wanted take the time here to hopefully convince you to move it higher up the priority list.
 lynchs61
on 9 Apr 2019
lynchs61
on 9 Apr 2019
Really, the company should be able to contribute few days of its own developers time to implement the alert and contribute it back. It's open source, after all.
 zdzichu
on 10 Apr 2019
zdzichu
on 10 Apr 2019
+1
 Derever
on 13 May 2019
Derever
on 13 May 2019
+1
 jpresto2
on 16 May 2019
jpresto2
on 16 May 2019
Singlestat is being rewritten, alerting will follow - I ask again that we lock this issue to contributors until such time as there's new information to report.
pdf
on 16 May 2019
+1
 emadct
on 16 May 2019
emadct
on 16 May 2019
+1
 sunil-samtani
on 23 May 2019
sunil-samtani
on 23 May 2019
+1
 diego-alves
on 7 Jun 2019
diego-alves
on 7 Jun 2019
+1
 jmaciasluque
on 19 Jun 2019
jmaciasluque
on 19 Jun 2019
+1
 khanu
on 15 Jul 2019
khanu
on 15 Jul 2019
For heaven's sake, please add this!
 horse27
on 15 Jul 2019
horse27
on 15 Jul 2019
Sorry to disturb but there are 91 people that would like to follow this thread and be notified when actual progress is being made. If you could avoid to keep writing +1 comments, swearings or similar I think it would be better for everyone. Those comments also don't help in speeding up the development, in case it wasn't clear...
EDIT: 91 is the number of participants, not subscribed people
 matteocontrini
on 15 Jul 2019
matteocontrini
on 15 Jul 2019
actually that would be a nice thing to give people tools to add alerts in custom panels
 Watermeloune
on 2 Aug 2019
Watermeloune
on 2 Aug 2019
+1
 androld
on 4 Sep 2019
androld
on 4 Sep 2019
+1
 fangxingfu
on 17 Sep 2019
fangxingfu
on 17 Sep 2019
We do need singlestat alert button and sound. +1
 cjt74392
on 7 Nov 2019
cjt74392
on 7 Nov 2019
+1 this would be yuge
 Drewster727
on 13 Nov 2019
Drewster727
on 13 Nov 2019
I searched for a while why the "Alerts" tab didn't appear and thought that my Grafana was bugged. Now I stumble upon this thread from 2016 stating that it's "normal" not being able to put an alert on single stats ? That's crazy!
Really hope you'll put this basic and needed feature on your roadmap asap. It's so basic that I don't understand why it's not enabled for this particular event.
 joxxxx
on 18 Nov 2019
joxxxx
on 18 Nov 2019
I searched for a while why the "Alerts" tab didn't appear and thought that my Grafana was bugged. Now I stumble upon this thread from 2016 stating that it's "normal" not being able to put an alert on single stats ? That's crazy!
Really hope you'll put this basic and needed feature on your roadmap asap. It's so basic that I don't understand why it's not enabled for this particular event.
Quote all, it's borderline embarassing missing a feature that's basically given for granted from people exploring the potential of grafana and it turns to completely awkward when the explicit request for it it's still pendig after THREE YEARS
geez
 Azertooth
on 18 Dec 2019
Azertooth
on 18 Dec 2019
You folks should really dial your tone down; this is open-source software that you get for free, nobody owes you anything.
If you're missing a feature so dearly, either contribute to the project or feel free to pick a different one.
 stefanotorresi
on 9 Jan 2020
stefanotorresi
on 9 Jan 2020
I appreciate the sentiment @stefanotorresi but I suspect you're shouting into the wind.
pdf
on 9 Jan 2020
To be fair not everyone has the skillset to contribute and yes its free but when you state on your website "Currently only the graph panel supports alert rules but this will be added to the Singlestat and Table panels as well in a future release" I think its ok for people to start getting a bit impatient when it doesn't even appear to be on the roadmap still
 abitrusty
on 9 Jan 2020
abitrusty
on 9 Jan 2020
You folks should really dial your tone down; this is open-source software that you get for free, nobody owes you anything.
If you're missing a feature so dearly, either contribute to the project or feel free to pick a different one.
That’s not entirely true. I’m a paying customer of Grafana Enterprise. I’ve raised this request through my CSM as well.
calebcall
on 9 Jan 2020
From https://github.com/grafana/grafana/pull/21416#issuecomment-572551160:
The current plan is to make alert rules it's own standalone thing (so not created as part of any panel or dashboard)
I don't see why this issue hasn't been closed, though, this being the case...
jmaciasluque
on 9 Jan 2020
+1 basic and expected!
 joaolcorreia
on 17 Jan 2020
joaolcorreia
on 17 Jan 2020
+1 Very much needed for us too.
 dilshaat
on 17 Jan 2020
dilshaat
on 17 Jan 2020
+1
 malanvaneck
on 21 Jan 2020
malanvaneck
on 21 Jan 2020
This thread is epic.
On 1/21/20, malanvaneck notifications@github.com wrote:
+1
--
You are receiving this because you are subscribed to this thread.
Reply to this email directly or view it on GitHub:
https://github.com/grafana/grafana/issues/6983#issuecomment-576861058
 rssalerno
on 21 Jan 2020
rssalerno
on 21 Jan 2020
Thanks to ALL the +1 comments, I finally unsubscribed from this post and will not get any updates anymore.
Which is a pity because I do want to know when they will fix this.
Many thanks to everybody wo gave a +1 for letting me make this decision. This is NOT how issue tracking of github works. you have the thumb up to let everybody know that you also wants this feature.
Kind regards
Jan
 JanVerstuyft
on 22 Jan 2020
JanVerstuyft
on 22 Jan 2020
Thanks to ALL the +1 comments, I finally unsubscribed from this post and will not get any updates anymore.
Which is a pity because I do want to know when they will fix this.
Many thanks to everybody wo gave a +1 for letting me make this decision. This is NOT how issue tracking of github works. you have the thumb up to let everybody know that you also wants this feature.
Kind regards
Jan
+1
horse27
on 22 Jan 2020
this is gold 😂
Azertooth
on 22 Jan 2020
Any news regarding the request?
The request on Github exists since 2016, it seems people need it.
It would be really helpful if the alarms are added not only into the Singlestats, but also for “Table”, “Gauge” and everything else.
 djbrunoatimix
on 20 Feb 2020
djbrunoatimix
on 20 Feb 2020
just for fun ==> +1 sorry - hope this stays the last comment EVER!
 Klar
on 20 Feb 2020
Klar
on 20 Feb 2020
It would be very nice to have it. +1 also....
 Virmagnus
on 4 Mar 2020
Virmagnus
on 4 Mar 2020
hope for it until the end of the word
 wkjun
on 6 Mar 2020
wkjun
on 6 Mar 2020
My promotion at work depends on this feature 😂
djbrunoatimix
on 6 Mar 2020
@djbrunoatimix that's great, so you have a perfect motivation to develop this feature. Go code! You will earn your promotion and gratidue of people in this feature request.
You can start at https://github.com/grafana/grafana/blob/master/CONTRIBUTING.md
zdzichu
on 6 Mar 2020
+1
 frlinux
on 25 Mar 2020
frlinux
on 25 Mar 2020
waiting since 2016.
wondering have any one figured out any workaround for this?
 Ajithkumarsekar
on 11 Apr 2020
Ajithkumarsekar
on 11 Apr 2020
waiting since 2016.
wondering have any one figured out any workaround for this?
Just checking back here after abandoning Grafana a year ago to see if there's been a change. Yes, there's a workaround. Use a different product.
I used this for visualizing data from Elasticsearch but without this alerting it's not very useful. See my comment above here.
Since I was only connecting to Elasticsearch, it was straight forward to just go with Kibana paired with Elastalert for my needs.
Of course, Grafana looks much nicer than Kibana, and Elastalert is way more tedious to setup. But at least it affords literally the most basic alerting feature.
lynchs61
on 30 Apr 2020
i think workaround is just to have a small tiny out of sight graph panel(with the alert) and a corresponding big singlestat panel together.
sunil-samtani
on 1 May 2020
I can't believe it is still not a feature.
 pwlgrzs
on 15 May 2020
pwlgrzs
on 15 May 2020
i think workaround is just to have a small tiny out of sight graph panel(with the alert) and a corresponding big singlestat panel together.
It's not really a good workaround for us, because if you want to change the corresponding metric, you have to change 2 panels. And when you have many graphs on different boards, grown over time and changed by different developers, it's easy to forget the change on a panel.
 FieteMax
on 25 May 2020
FieteMax
on 25 May 2020
+1
 Orilcious
on 31 May 2020
Orilcious
on 31 May 2020
+1
 BrandonNC
on 15 Jun 2020
BrandonNC
on 15 Jun 2020
UP!!! 4 Year !!!!
But adding Singlestat or Gauge is not such a difficult problem!
Developers, you could take 2 steps:
- Give users what they want
- Recycle alerts as you want and then roll out the update
But you only feed with promises!
 Scrik
on 23 Jun 2020
Scrik
on 23 Jun 2020
OMG it's not implemented yet1?
+1
+1
+1
...
 mrh666
on 24 Jun 2020
mrh666
on 24 Jun 2020
This hasn't been added? Any workarounds? Pretty embracing trying to make a professional implementation to ship and for getting alerts a second dashboard to hide all these graphs is needed
 crb596
on 24 Jun 2020
crb596
on 24 Jun 2020
Please add it
 PaulDach
on 25 Jun 2020
PaulDach
on 25 Jun 2020
+1 for Singlestats
+1 for Gauge
+1 for Table
 MargulisMax
on 8 Jul 2020
MargulisMax
on 8 Jul 2020
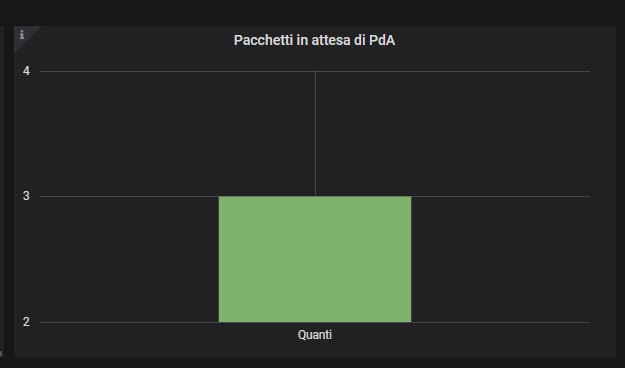
my workaround is to change a Gauge inside a Graph with this configuration,
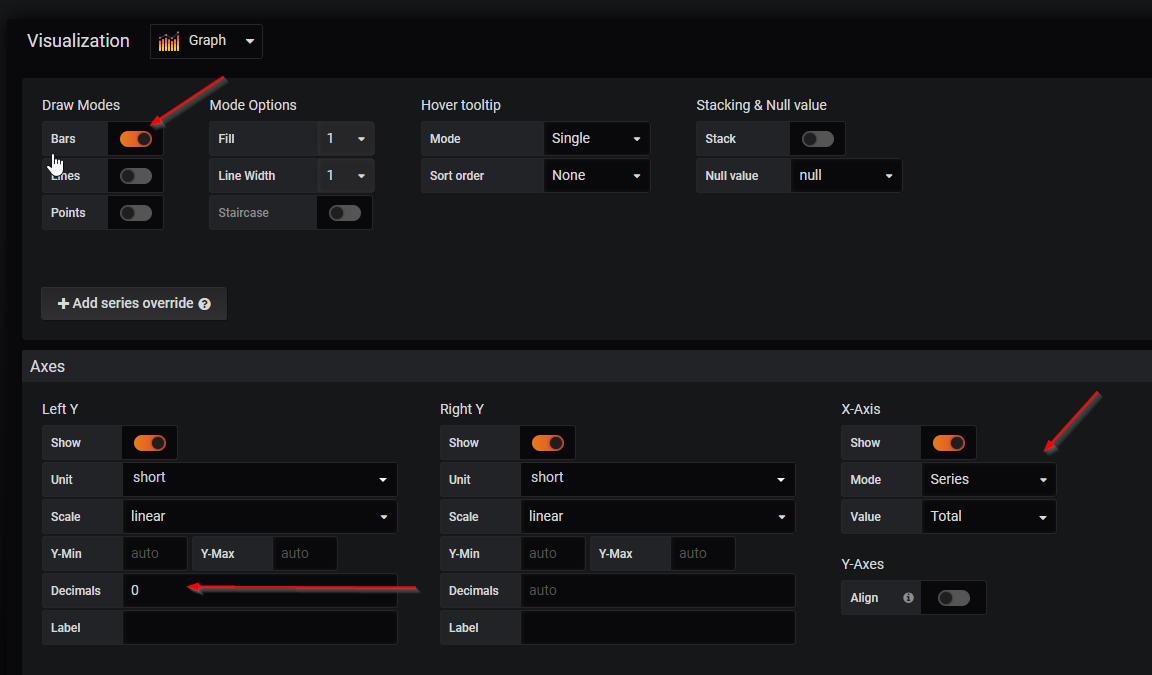
that permits the use of alerts
morphing this
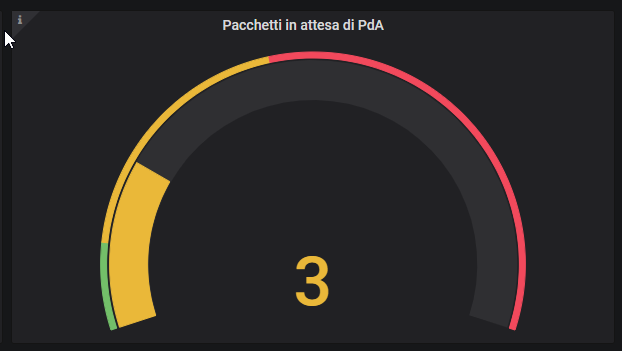
to this
 andreabisello
on 23 Jul 2020
andreabisello
on 23 Jul 2020
its long opened
 alishah730
on 3 Aug 2020
alishah730
on 3 Aug 2020
4 years for this!?
 CodingBeagle
on 13 Aug 2020
CodingBeagle
on 13 Aug 2020
still wait this feature. +1
 poloHex
on 22 Sep 2020
poloHex
on 22 Sep 2020
+1
 revantjainmaf
on 23 Sep 2020
revantjainmaf
on 23 Sep 2020
+1
 jaaakob-io
on 29 Sep 2020
jaaakob-io
on 29 Sep 2020
+1
 prachirokade
on 29 Sep 2020
prachirokade
on 29 Sep 2020
Getting endless +1 from this thread for years finally got me tired, unsubscribing and migrating...
 emexelem
on 29 Sep 2020
emexelem
on 29 Sep 2020
Dear github newbs. Your +1's are annoying since they trigger an email to all followers without contributing anything new to the discussion. If you only want to add emphasis, please instead add to the count of thumbs up in the original message. [cue onslaught of hilarious "ironic" +1 messages]
 holmesb
on 29 Sep 2020
holmesb
on 29 Sep 2020
Dear github newbs. Your +1's are annoying since they trigger an email to all followers without contributing anything new to the discussion. If you only want to add emphasis, please instead add to the count of thumbs up in the original message. [cue onslaught of hilarious "ironic" +1 messages]
+1
Azertooth
on 29 Sep 2020
I just found a workaround, which make this issue more ridiculous since the problem is "only" the tab "alert" who isn't display for singlestat panel (or other kind of panel)
If you write the JSON model with the alert and a singlestats, you can setup the alert and it's just works (I sent alert to slack with image)
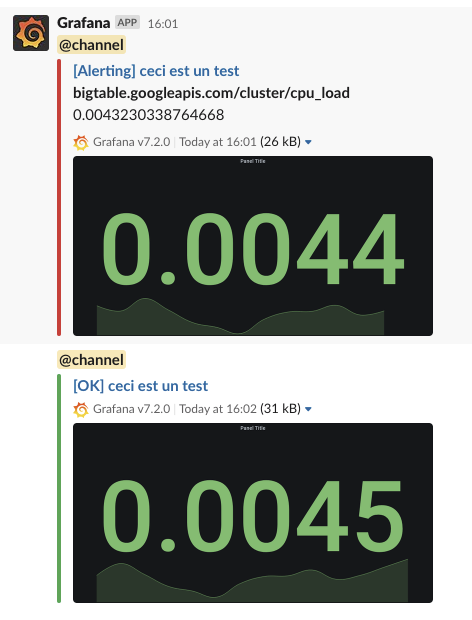
Of course the threshold isn't automatically setup but you can set it manually
EDIT: Basically you can configure the panel with a graph, edit the json model and change "type": "graph" to "type": "stat"
 Eraac
on 29 Sep 2020
Eraac
on 29 Sep 2020
dear developers we waiting 4 years.
 Nurlan199206
on 14 Oct 2020
Nurlan199206
on 14 Oct 2020
+1
 scroodj
on 15 Oct 2020
scroodj
on 15 Oct 2020
Still figuring some major aspects, but in broad strokes:
- Alert definitions become their own objects/views (and then panels will be able to subscribe to them, or their instances). Largely for https://github.com/grafana/grafana/issues/7832
- Alert definitions can create multiple alert instances. For example, host=* could be per-host alerts.
From that, the parts relevant to this:
- Have server side expressions that reduce time series data to single stats, and be able to display them and create conditions.
- Allow already reduced data as alerting input
So there will be alerting on queries that return a single number, or multiple numbers with key/value labels that can be alerted on, and then can also be visualized. But it will flip the relationship some so it is not quite alerting on single stat _panels_, since alerts will not be tied directly one-to-one to panels.
Some ugly pocs:
Alert on already reduced data, alerts per state/country (where countByState would the response from a SQL avg(value) group by state where ... or something like a prom instant vector query:

Alert on two time series queries (different time periods) and compare them against thresholds (per state):
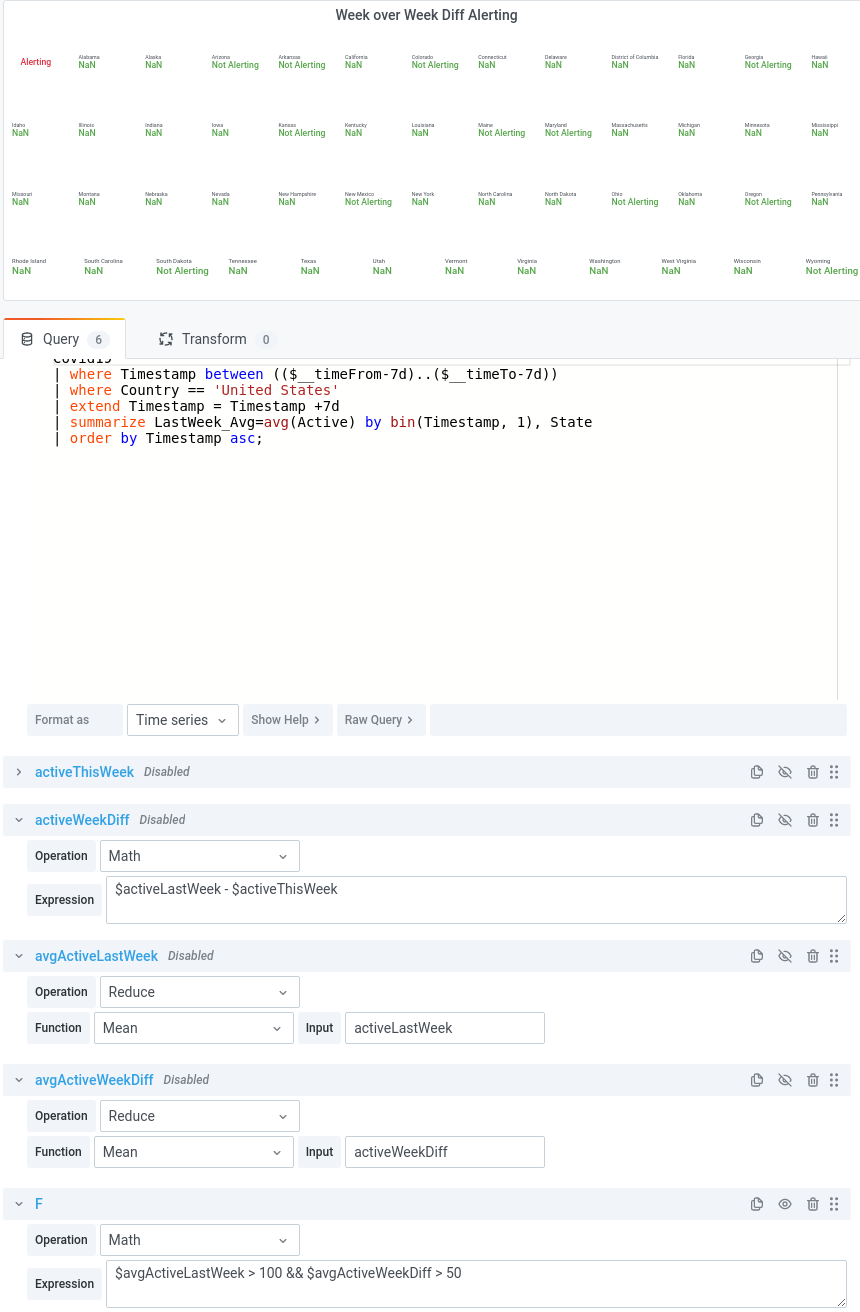
Those "expression" boxes above do not manipulate the data, but rather adds data to the response. So using the previous example "F" would be the condition, and visualizing that (to work within current poc constrains). The "eye/hidden" icon in this case isn't disabling the queries, it is just not having them to sent to the front end (for now).
 kylebrandt
on 20 Oct 2020
kylebrandt
on 20 Oct 2020
+1
 ducnguyen2595
on 5 Nov 2020
ducnguyen2595
on 5 Nov 2020
How many years has it been? Four, it has been four years since this was requested ...
 kesor
on 26 Nov 2020
kesor
on 26 Nov 2020
Even though singlestat has been replaced by stat I still need this - I am trying to use it to gauge response codes from sites and send me a notification when there is an issue with them
 RobinDadswell
on 1 Dec 2020
RobinDadswell
on 1 Dec 2020
Wow. I cannot believe this is already 4 years old :D Sad.
 fuuman
on 2 Dec 2020
fuuman
on 2 Dec 2020
+1
 fifipil909
on 5 Dec 2020
fifipil909
on 5 Dec 2020
happy birthday to singlestat alerts request !
sunil-samtani
on 16 Dec 2020
+1
 kwri-avongluck
on 31 Dec 2020
kwri-avongluck
on 31 Dec 2020
Related issues
 yuvaraj951
·
3Comments
yuvaraj951
·
3Comments
 sslupsky
·
3Comments
sslupsky
·
3Comments
 Azef1
·
3Comments
Azef1
·
3Comments
 tuxinaut
·
3Comments
tuxinaut
·
3Comments
 jackmeagher
·
3Comments
jackmeagher
·
3Comments
Most helpful comment
+1