Grafana: [Feat] Conditional formatting
Introduction
As of writing (Grafana v5.1-pre) we have support for
- coloring background/value in the Singlestat panel based on a numeric range and 3 colors
- coloring cell/value/row in the Table panel based on a numeric range and 3 colors
There are a lot of feature requests/issues requesting greater support of coloring in table panel and the singlestat panel:
- #7631 [Feature request] Allow Text to Value mappings in Singlestat panel
- #3601 table panel: colorize cell value based on regex pattern match
- #9500 Feature request: Allow thresholds for Time column in tables
- #3608 Thresholds with more than 3 comma-separated values
- #8404 [Feature request] Singlestat null value color
- #4821 Table Panel coloring shouldn't require display of referenced column
- #9709 Single stat panel with gradient color
- #7411 [Feature request] Variable threshold values in Singlestats panel
- #7286 [Feature request] Row and/or Column styles in Table
Historically we've received a few PR's that tried to solve some of the issues above, but we haven't been able to merge them because we feel the solutions are either hard to understand from a user perspective or either it makes the Grafana code base/features more and more shattered.
Proposal
This issue aims to find one solution for solving all (or most) of the issues above and by that delivering a good and consistent user experience. By that said, we probably want to split this up in smaller issues if we decide that this is a good way forward.
In general the Conditions editor for alerts are very similar to a rule/conditional formatting editor functionality and would probably fit quite nice with a few modifications. This is something to take into considerations when implementing this.
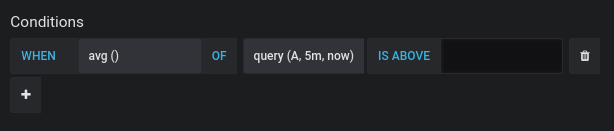
Conditional rules evaluator
A panel needing conditional formatting shouldn't need to implement their own solution for evaluating conditional rules thus making this a core component/helper library is a must.
It would be nice if this component also could return a list of rule types that it supports.
Examples of rule types:
- Value is empty
- Value is not empty
- Text contains
- Text does not contain
- Text starts with
- Text ends with
- Text is exactly
- Date is
- Date is before
- Date is after
- Greater than
- Greater than or equal to
- Less than
- Less than or equal to
- Is equal to
- Is not equal to
- Is between
- Is not between
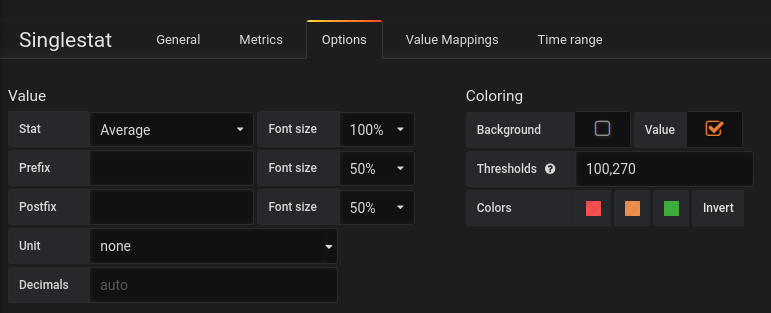
Singlestat panel - colorize background/value
Changes here compared to current functionality is that
- it allow you to define unlimited amount of color formatting's compared to today's maximum of three.
- it allow support for coloring based on empty/non-empty values
- it allow support for coloring based on string/text values
- it allow support for coloring based on date/duration values
UX mockup/example to underline functionality needed/wanted
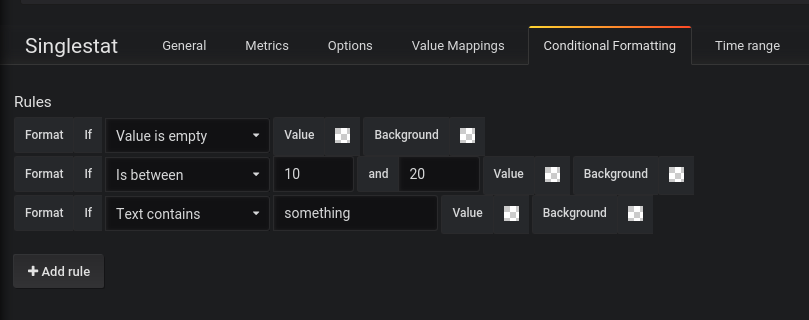
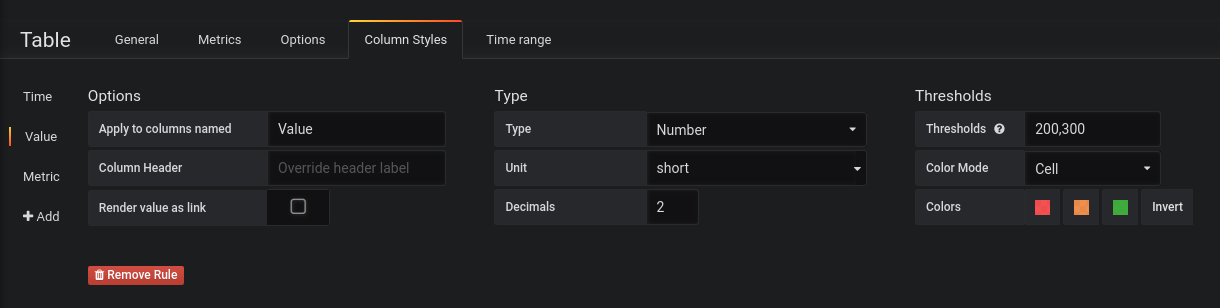
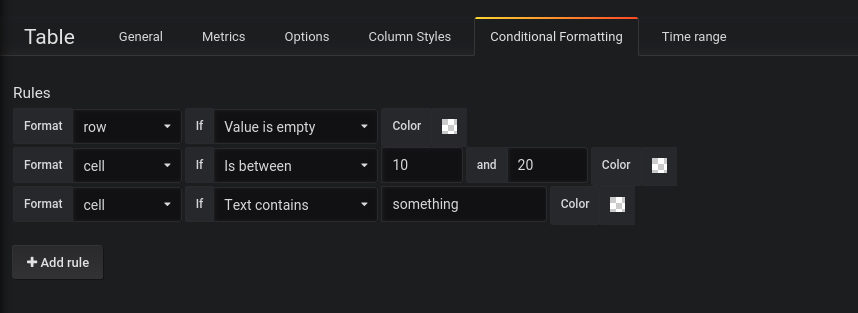
Table panel - colorize cells/values/rows
Changes here compared to current functionality is that
- it allow you to define unlimited amount of color formatting's compared to today's maximum of three.
- it allow support for coloring based on empty/non-empty values
- it allow support for coloring based on string/text values
- it allow support for coloring based on date/duration values
- it allow support for coloring a row based on a hidden/non-rendered column
Currently you can define thresholds for each defined Column style. Maybe we want to continue having this possibility since we can make smart decisions of what columns to apply the conditional formatting rules to.
On the other hand it quite weird to continue using the column styles since they're basically provides options for how to render column cells/convert raw column value using specific data types and options etc. Regarding coloring we currently supports cell/value/row which affects cells or rows and rules are evaluated based on the raw data returned from data source query, that is not after conversion/options. In the mockup below there's a really simple UX which basically would scan all rows and columns returned from data source query to apply conditional formatting.
One option to having conditional formatting inside the Column style tab would be to allow conditional formatting rules to be applied per columns basis under a specific tab. Basically like the mockup below but with additional logic to decide which columns the rules should be applied to. This solution have an advantage because it can support conditional formatting of rows based on a hidden/non-rendered column.
UX mockup/example to underline functionality needed/wanted
Forward compatibility
Any changes needed to existing Singlestat and Table panel JSON models should be forward compatible, meaning that existing saved dashboards with Singlestat/Table panel having coloring/threshold enabled should be migrated/converted to the new solution when such a dashboard is rendered.
 marefr
All 77 comments
I think this proposal sounds pretty good. One thing I'd like to mention that would tie into this: panels and alerts would become so much more powerful if thresholds could be defined based on other queries.
An example would be monitoring a ceph cluster. Ceph requires a set of daemons to form a quorum. It would be very helpfull if there would be an option to make a panel that tracks the number of daemons in-quorum a) goes yellow if number_in_quorum < number_all_daemons and b) goes red if number_in_quorum < number_all_daemons / 2 + 1
 jan--f
on 3 Apr 2018
jan--f
on 3 Apr 2018
@torkelo do you have any input on this?
marefr
on 5 Apr 2018
I think this looks very interesting. It generalizes a concept and in a way makes it easier to use (The current thresholds csv string is a bit confusing)
 torkelo
on 9 Apr 2018
torkelo
on 9 Apr 2018
Not sure where this input should get factored in...but I'd like to see something along the line of say, Column A contains a text value, and Column B contains a numeric value (0 or 1) and is also hidden from the display. When Column B is say 0, Column A is colored Red (with white text) and when Column B is say 1, Column A is colored Green (with white text). In other words, can one column be consulted to control the color attribute of another column, or alternatively, can conditions for a column's color be expressed by factoring in other column data?
 centipede16
on 17 Apr 2018
centipede16
on 17 Apr 2018
@centipede16 Yes, that's what this line is about for the table panel
- it allow support for coloring a row based on a hidden/non-rendered column
marefr
on 19 Apr 2018
Ok. Is there a rough timeframe of when such functionality would tentatively be made available, e.g. sometime in 2018 or no commitments have yet been made?
centipede16
on 19 Apr 2018
No timeframe or milestone right now but giving that this and related issues have many votes we'll try and come back with more information as soon as we know more.
marefr
on 19 Apr 2018
I think this is included with #7411 but I just want to reiterate that wherever possible, these condition fields should accept template variables as values.
 IntegersOfK
on 9 May 2018
IntegersOfK
on 9 May 2018

Will keep eyes on this topic.
 crazy-canux
on 30 May 2018
crazy-canux
on 30 May 2018
+1 on these. Having to adapt our data specification to Grafana format limitations is not ideal!
 XabiBeltza
on 26 Jul 2018
XabiBeltza
on 26 Jul 2018
+1, @marefr any updates on this ?
 sebawo
on 27 Aug 2018
sebawo
on 27 Aug 2018
@sebawo No, not yet I'm afraid.
marefr
on 27 Aug 2018
+1.
 r02b
on 6 Sep 2018
r02b
on 6 Sep 2018
+1
 lauraquah
on 18 Sep 2018
lauraquah
on 18 Sep 2018
+1
 mjtrangoni
on 2 Oct 2018
mjtrangoni
on 2 Oct 2018
+1
 tcase
on 4 Oct 2018
tcase
on 4 Oct 2018
+1
 ahothan
on 8 Oct 2018
ahothan
on 8 Oct 2018
+1
 jaclag
on 26 Oct 2018
jaclag
on 26 Oct 2018
I'd like to declare that writting "+1" will not anyhow raise work for this item. Please keep that aside, this will be processed once there will have some developer time for it. Or, instead You could have already started the work on it. :-) Thanks
 Tatranskymedved
on 26 Oct 2018
Tatranskymedved
on 26 Oct 2018
Sounds great.
Would also need to be able to easily change order of which rule applies first/last
 nico100
on 9 Nov 2018
nico100
on 9 Nov 2018
What happened to Thresholds for date?
 flopp999
on 20 Dec 2018
flopp999
on 20 Dec 2018
What happened to Thresholds for date?
+1
 bmfmsd
on 20 Dec 2018
bmfmsd
on 20 Dec 2018
@marefr is there any progress on this? We really would love this to get properly going with our monitoring usung grafana, we have different warn/crit levels for the same service we are monitoring on different servers and to be able to use a query value as threshold would mean a lot less manual work for us!
 DennisMC
on 8 Jan 2019
DennisMC
on 8 Jan 2019
I'm very interested of this topic! In particular of: "_#3608 Thresholds with more than 3 comma-separated values_".
Are there any news about it?
 busi91
on 13 Jan 2019
busi91
on 13 Jan 2019
+1 !
Simple things are often the most powerful and most needed !
I'd love to see these feature anytime soon !
Can you give some news about it ? Especially Thresholds with more than 3 comma-separated values.
 CygaLV
on 5 Feb 2019
CygaLV
on 5 Feb 2019
This was opened almost a year ago - is there any status on the progress?
 enzoweb
on 5 Feb 2019
enzoweb
on 5 Feb 2019
This was opened almost a year ago - is there any status on the progress?
Also wondering about progress here. I am looking to use the singlestat with an additional number of thresholds and colours in order to display a variety of status values
 Jordan-sl
on 13 Feb 2019
Jordan-sl
on 13 Feb 2019
Any good news on the feature "table panel: colorize cell value based on regex pattern match #3601". It would have been nicer if we could color a text based on regex or string comparison (eg. "Failed" - Red, "Processing" - Yello, "Processed" - Green).
 prasanthgv
on 18 Feb 2019
prasanthgv
on 18 Feb 2019
Short update. We've been focusing on Angular to React migration and due to this we haven't been able to look into this. We want to look into this after graph, table and other panels have been migrated to React to make this a future proof solution that can be reused by all core and external panels.
marefr
on 18 Feb 2019
Being able to conditionally change color in tables cells based on string would be very helpful to my project. This would go a long way in legitimizing grafana in our organization. Everyone is very impressed but I get these request often. "Can you change the color in the table to show
 dslaughter
on 19 Feb 2019
dslaughter
on 19 Feb 2019
Any progress on this?
 yrshaikh
on 1 Apr 2019
yrshaikh
on 1 Apr 2019
Do we have any update on this?
Definitely is a must have function.
 joseapdmota
on 4 Apr 2019
joseapdmota
on 4 Apr 2019
+1
 alexvaut
on 5 Apr 2019
alexvaut
on 5 Apr 2019
Any update on this?
 tuxknight
on 17 Apr 2019
tuxknight
on 17 Apr 2019
+1
 TH-HA
on 18 Apr 2019
TH-HA
on 18 Apr 2019
I would also like to have this feature
 tcpdumper
on 18 Apr 2019
tcpdumper
on 18 Apr 2019
I am working on something similar. This is Boom Summary panel used to transform table into summary of data. May be useful if anyone looking for this.


 yesoreyeram
on 18 Apr 2019
yesoreyeram
on 18 Apr 2019
I think in this issue https://github.com/grafana/grafana/pull/9455 solution would already be deployed at least to be used temporarely until the current approach gets implemented, Sorry, but the other issue was closed and this one is taking too long to get deployed. :(
 Brun0fl
on 28 May 2019
Brun0fl
on 28 May 2019
Would also like this to be a feature, specifically the table string to colour mappings that would be real handy for displaying a "legend" for annotations.
 AppleMaster
on 12 Jun 2019
AppleMaster
on 12 Jun 2019
Any updates as to the progress of this request? I have a project awaiting this capability for a SOC monitoring dashboard.
 freddles
on 23 Jul 2019
freddles
on 23 Jul 2019
Would also appreciate that this feature will be implemented 😎
 Ringeltier
on 26 Aug 2019
Ringeltier
on 26 Aug 2019
I’m looking forward to this feature as well. Especially on a table panel. Any ETA?
What stage is it at? planned or started development?
 amjad
on 26 Aug 2019
amjad
on 26 Aug 2019
Should we expect any progress on this? :-)
 erayalakese
on 10 Sep 2019
erayalakese
on 10 Sep 2019
Any eta on a fix?
 WilliamLHarms
on 16 Sep 2019
WilliamLHarms
on 16 Sep 2019
Def looking forward to this feature. Hoping to start using it soon
 apanagar
on 18 Sep 2019
apanagar
on 18 Sep 2019
Hi, any update on this?
 thiagocorredor
on 26 Sep 2019
thiagocorredor
on 26 Sep 2019
Also, I found a plugin that can helps for this request:
https://grafana.com/grafana/plugins/yesoreyeram-boomtable-panel
thiagocorredor
on 26 Sep 2019
I support #9500. I'm using grafana to show a sequence of timed orders and I want to highlight the ones that are expired.
 pdMa2s
on 4 Oct 2019
pdMa2s
on 4 Oct 2019
Any progress on this feature ?
 tonybounty
on 26 Oct 2019
tonybounty
on 26 Oct 2019
Really interested in https://github.com/grafana/grafana/issues/9500 . Like most other want to highlight when there was a long time since update.
 karln-star
on 31 Oct 2019
karln-star
on 31 Oct 2019
+1
 carloshgaray
on 22 Nov 2019
carloshgaray
on 22 Nov 2019
+9000
 biertie
on 17 Dec 2019
biertie
on 17 Dec 2019
9500 and #3601 would significantly improve our dashboards
 marvinO1
on 17 Dec 2019
marvinO1
on 17 Dec 2019
In my case I would like to show different colours on my graphs depending on the date
pdMa2s
on 19 Dec 2019
Hi
Is "#7631 [Feature request] Allow Text to Value mappings in Singlestat panel" implemented ?
 Syed-Ali
on 28 Jan 2020
Syed-Ali
on 28 Jan 2020
For new "stat" panel, it will be nice if different threshold can be set for different queries.
 fyang13
on 31 Jan 2020
fyang13
on 31 Jan 2020
I am working on something similar. This is Boom Summary panel used to transform table into summary of data. May be useful if anyone looking for this.
it appears we tried to use this but get a crash on our server using Elastisearch. using Grafana 6.5.2
 xslugx
on 6 Feb 2020
xslugx
on 6 Feb 2020
Any update on this?
 safadig
on 13 Feb 2020
safadig
on 13 Feb 2020
I don't understand, I was looking for a solution for request #9500, found PR #10594 that looks promising to me. This PR has been closed by this current feature, in which I don't find any solution to the initial request.
Did I miss something ?
 eRudy
on 27 Feb 2020
eRudy
on 27 Feb 2020
+1 plix
 Go-Pomegranate
on 3 Mar 2020
Go-Pomegranate
on 3 Mar 2020
Very interested in that feature !
 Ilium77
on 19 Mar 2020
Ilium77
on 19 Mar 2020
+1
 malanvaneck
on 25 Mar 2020
malanvaneck
on 25 Mar 2020
+1
 alecm858
on 27 Mar 2020
alecm858
on 27 Mar 2020
This is an interesting feature... Any update?
 iconde
on 15 Apr 2020
iconde
on 15 Apr 2020
Can you provide some workaround at least?
 vlatk0o
on 7 May 2020
vlatk0o
on 7 May 2020
+1
 Jqute
on 26 May 2020
Jqute
on 26 May 2020
+1
 cwildfoerster
on 16 Jun 2020
cwildfoerster
on 16 Jun 2020
+1
 myriamvanerum
on 17 Jul 2020
myriamvanerum
on 17 Jul 2020
This feature request is really promising. Even only text to value mapping would improve dashboarding with grafana greatly. I guess we have to create a numeric value in the database for now. Please share if you know a workaround other than keeping a numeric index in the data source.
 mertbakir
on 17 Jul 2020
mertbakir
on 17 Jul 2020
+1
 maemigh
on 3 Sep 2020
maemigh
on 3 Sep 2020
+1
 jacobreid
on 5 Sep 2020
jacobreid
on 5 Sep 2020
+1
 scroodj
on 9 Sep 2020
scroodj
on 9 Sep 2020
+1
 stickybyte
on 29 Sep 2020
stickybyte
on 29 Sep 2020
Anyone know if there is any update on the ability to map string values to integers to be able to visualize on a graph? This issue here was referenced from #14222
 miguelarios
on 27 Oct 2020
miguelarios
on 27 Oct 2020
+1
 fa1861
on 4 Nov 2020
fa1861
on 4 Nov 2020
Hi @marefr , when can we expect this feature available? rough estimate
 Soumyank
on 11 Dec 2020
Soumyank
on 11 Dec 2020
I really need this kind of displaying colored cells depending on string value
 brunofds
on 7 Jan 2021
brunofds
on 7 Jan 2021
Related issues
 german-bortoli
·
95Comments
german-bortoli
·
95Comments
 calind
·
126Comments
calind
·
126Comments
 costimuraru
·
132Comments
costimuraru
·
132Comments
 Dieterbe
·
294Comments
costimuraru
·
162Comments
Dieterbe
·
294Comments
costimuraru
·
162Comments
Most helpful comment
Short update. We've been focusing on Angular to React migration and due to this we haven't been able to look into this. We want to look into this after graph, table and other panels have been migrated to React to make this a future proof solution that can be reused by all core and external panels.