Highcharts: Pie / Donut charts - Connector lines get missed out on some dense chart areas
Expected behaviour
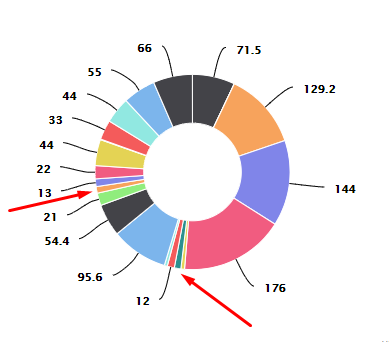
Connector lines should be visible for all pie / donut segments.
Actual behaviour
Connector lines are not drawn for segments that are too small, existing in between densely populated data segments.
Live demo with steps to reproduce
Product version
6.0.7
Affected browser(s)
Chrome, Firefox, IE, Edge, ... (All browsers).
 ananth-imagin
All 3 comments
Hi @ananth-imagin
Thank you for reporting the issue. This is expected behaviour. If we don't have enough space for the labels then we don't render them. Labels with the lowest values are hidden first - this can be controlled by point.labelrank.
We can increase the distance to make more space for labels: http://jsfiddle.net/BlackLabel/FKawc/67/ - but it depends on the dataset. Or decrease padding around the labels: http://jsfiddle.net/BlackLabel/FKawc/78/
 pawelfus
on 23 Feb 2018
pawelfus
on 23 Feb 2018
Additionally: the function responsible for the dataLabels distribution is Highcharts.distribute. You can override it and provide better logic if you have one. Here's a demo with simple modification (JS line 42) that changes size of the labels (when used in calculations):
http://jsfiddle.net/BlackLabel/9f5orgn4/
 KacperMadej
on 23 Feb 2018
KacperMadej
on 23 Feb 2018
Hi @pawelfus & @KacperMadej ,
Thank you very much for the solutions!
Greatly appreciate your help.
Thanks,
Ananth
ananth-imagin
on 26 Feb 2018
Related issues
 Izothep
·
34Comments
Izothep
·
34Comments
 Bigous
·
47Comments
Bigous
·
47Comments
 vviikk
·
36Comments
vviikk
·
36Comments
 kzoon
·
26Comments
kzoon
·
26Comments
 dandv
·
32Comments
dandv
·
32Comments
Most helpful comment
Additionally: the function responsible for the dataLabels distribution is Highcharts.distribute. You can override it and provide better logic if you have one. Here's a demo with simple modification (JS line 42) that changes size of the labels (when used in calculations):
http://jsfiddle.net/BlackLabel/9f5orgn4/