Pytorch: possible deadlock in dataloader
the bug is described at pytorch/examples#148. I just wonder if this is a bug in PyTorch itself, as the example code looks clean to me. Also, I wonder if this is related to #1120.
 zym1010
All 189 comments
How much free memory do you have when the loader stops?
 apaszke
on 25 Apr 2017
apaszke
on 25 Apr 2017
@apaszke if I check top, the remaining memory (cached mem also counts as used) is usually 2GB. But if you don't count cached as used, it's always a lot, say 30GB+.
zym1010
on 25 Apr 2017
Also I don't understand why it always stops at beginning of validation, but not everywhere else.
zym1010
on 25 Apr 2017
Possibly because for validation a separate loader is used that pushes the use of shared memory over the limit.
 ngimel
on 25 Apr 2017
ngimel
on 25 Apr 2017
@ngimel
I just ran the program again. And got stuck.
Output of top:
~~~
top - 17:51:18 up 2 days, 21:05, 2 users, load average: 0.49, 3.00, 5.41
Tasks: 357 total, 2 running, 355 sleeping, 0 stopped, 0 zombie
%Cpu(s): 1.9 us, 0.1 sy, 0.7 ni, 97.3 id, 0.0 wa, 0.0 hi, 0.0 si, 0.0 st
KiB Mem: 65863816 total, 60115084 used, 5748732 free, 1372688 buffers
KiB Swap: 5917692 total, 620 used, 5917072 free. 51154784 cached Mem
PID USER PR NI VIRT RES SHR S %CPU %MEM TIME+ COMMAND 3067 aalreja 20 0 143332 101816 21300 R 46.1 0.2 1631:44 Xvnc
16613 aalreja 30 10 32836 4880 3912 S 16.9 0.0 1:06.92 fiberlamp 3221 aalreja 20 0 8882348 1.017g 110120 S 1.3 1.6 579:06.87 MATLAB
1285 root 20 0 1404848 48252 25580 S 0.3 0.1 6:00.12 dockerd 16597 yimengz+ 20 0 25084 3252 2572 R 0.3 0.0 0:04.56 top
1 root 20 0 33616 4008 2624 S 0.0 0.0 0:01.43 init
~~~
Output of free
~
yimengzh_everyday@yimengzh:~$ free
total used free shared buffers cached
Mem: 65863816 60122060 5741756 9954628 1372688 51154916
-/+ buffers/cache: 7594456 58269360
Swap: 5917692 620 5917072
~
Output of nvidia-smi
~~~
yimengzh_everyday@yimengzh:~$ nvidia-smi
Tue Apr 25 17:52:38 2017
+-----------------------------------------------------------------------------+
| NVIDIA-SMI 375.39 Driver Version: 375.39 |
|-------------------------------+----------------------+----------------------+
| GPU Name Persistence-M| Bus-Id Disp.A | Volatile Uncorr. ECC |
| Fan Temp Perf Pwr:Usage/Cap| Memory-Usage | GPU-Util Compute M. |
|===============================+======================+======================|
| 0 GeForce GTX TIT... Off | 0000:03:00.0 Off | N/A |
| 30% 42C P8 14W / 250W | 3986MiB / 6082MiB | 0% Default |
+-------------------------------+----------------------+----------------------+
| 1 Tesla K40c Off | 0000:81:00.0 Off | Off |
| 0% 46C P0 57W / 235W | 0MiB / 12205MiB | 0% Default |
+-------------------------------+----------------------+----------------------+
+-----------------------------------------------------------------------------+
| Processes: GPU Memory |
| GPU PID Type Process name Usage |
|=============================================================================|
| 0 16509 C python 3970MiB |
+-----------------------------------------------------------------------------+
~~~
I don't think it's a memory issue.
zym1010
on 25 Apr 2017
There are separate limits for shared memory. Can you try ipcs -lm or cat /proc/sys/kernel/shmall and cat /proc/sys/kernel/shmmax? Also, does it deadlock if you use fewer workers (e.g. test with the extreme case of 1 worker)?
apaszke
on 26 Apr 2017
@apaszke
~~~
yimengzh_everyday@yimengzh:~$ ipcs -lm
------ Shared Memory Limits --------
max number of segments = 4096
max seg size (kbytes) = 18014398509465599
max total shared memory (kbytes) = 18446744073642442748
min seg size (bytes) = 1
yimengzh_everyday@yimengzh:~$ cat /proc/sys/kernel/shmall
18446744073692774399
yimengzh_everyday@yimengzh:~$ cat /proc/sys/kernel/shmmax
18446744073692774399
~~~
how do they look for you?
as for fewer workers, I believe it won't happen that often. (I can try now). But I think in practice I need that many workers.
zym1010
on 26 Apr 2017
You have a max of 4096 shared memory segments allowed, maybe that's an issue. You can try increasing that by writing to /proc/sys/kernel/shmmni (maybe try 8192). You may need superuser privileges.
apaszke
on 26 Apr 2017
@apaszke well these are default values by both Ubuntu and CentOS 6... Is that really an issue?
zym1010
on 26 Apr 2017
@apaszke when running training program, ipcs -a actually shows no shared memory being used. Is that expected?
zym1010
on 26 Apr 2017
@apaszke tried running the program (still 22 workers) with following setting on shared mem, and stuck again.
~~~
yimengzh_everyday@yimengzh:~$ ipcs -lm
------ Shared Memory Limits --------
max number of segments = 8192
max seg size (kbytes) = 18014398509465599
max total shared memory (kbytes) = 18446744073642442748
min seg size (bytes) = 1
~~~
didn't try one worker. first, that would be slow; second, if the problem is really dead locking, then it would definitely disappear.
zym1010
on 26 Apr 2017
@zym1010 default settings doesn't have to be created with such workloads in mind, so yes it might have been an issue. ipcs is for System V shared memory which we aren't using, but I wanted to make sure the same limits don't apply to POSIX shared memory.
It wouldn't definitely disappear, because if the problem is really there, then it's likely a deadlock between the worker and main process, and one worker might be enough to trigger this. Anyway, I can't fix the issue until I can reproduce it. What are the parameters you're using to run the example and did you modify the code in any way? Also, what's the value of torch.__version__? Are you running in docker?
apaszke
on 26 Apr 2017
@apaszke Thanks. I understand your analysis much better now.
All other results shown to you up to how are performed on a Ubuntu 14.04 machine with 64GB RAM, dual Xeon, and Titan Black (there's also a K40, but I didn't use it).
The command to generate the problem is CUDA_VISIBLE_DEVICES=0 PYTHONUNBUFFERED=1 python main.py -a alexnet --print-freq 20 --lr 0.01 --workers 22 --batch-size 256 /mnt/temp_drive_3/cv_datasets/ILSVRC2015/Data/CLS-LOC. I didn't modify code at all.
I installed pytorch through pip, on Python 3.5. pytorch version is 0.1.11_5. Not running in Docker.
BTW, I also tried using 1 worker. But I did it on another machine (128GB RAM, dual Xeon, 4 Pascal Titan X, CentOS 6). I ran it using CUDA_VISIBLE_DEVICES=0 PYTHONUNBUFFERED=1 python main.py -a alexnet --print-freq 1 --lr 0.01 --workers 1 --batch-size 256 /ssd/cv_datasets/ILSVRC2015/Data/CLS-LOC, and the error log is as follows.
Epoch: [0][5003/5005]   Time 2.463 (2.955)      Data 2.414 (2.903)      Loss 5.9677 (6.6311)    Prec@1 3.516 (0.545)    Prec@5 8.594 (2.262)
Epoch: [0][5004/5005]   Time 1.977 (2.955)      Data 1.303 (2.903)      Loss 5.9529 (6.6310)    Prec@1 1.399 (0.545)    Prec@5 7.692 (2.262)
^CTraceback (most recent call last):
  File "main.py", line 292, in <module>
    main()
  File "main.py", line 137, in main
    prec1 = validate(val_loader, model, criterion)
  File "main.py", line 210, in validate
    for i, (input, target) in enumerate(val_loader):
  File "/home/yimengzh/miniconda2/envs/pytorch/lib/python3.5/site-packages/torch/utils/data/dataloader.py", line 168, in __next__
    idx, batch = self.data_queue.get()
  File "/home/yimengzh/miniconda2/envs/pytorch/lib/python3.5/queue.py", line 164, in get
    self.not_empty.wait()
  File "/home/yimengzh/miniconda2/envs/pytorch/lib/python3.5/threading.py", line 293, in wait
    waiter.acquire()
the top showed the following when stuck with 1 worker.
~
top - 08:34:33 up 15 days, 20:03, 0 users, load average: 0.37, 0.39, 0.36
Tasks: 894 total, 1 running, 892 sleeping, 0 stopped, 1 zombie
Cpu(s): 7.2%us, 2.8%sy, 0.0%ni, 89.7%id, 0.3%wa, 0.0%hi, 0.0%si, 0.0%st
Mem: 132196824k total, 131461528k used, 735296k free, 347448k buffers
Swap: 2047996k total, 22656k used, 2025340k free, 125226796k cached
~
zym1010
on 26 Apr 2017
another thing I found is that, if I modified the training code, so that it won't go through all batches, let say, only train 50 batches
if i >= 50:
    break
then the deadlock seems to disappear.
zym1010
on 26 Apr 2017
further testing seems to suggest that, this freezing much more frequently happens if I ran the program just after rebooting the computer. After there's some cache in the computer, seems that the frequency of getting this freezing is less.
zym1010
on 27 Apr 2017
I tried, but I can't reproduce this bug in any way.
apaszke
on 4 May 2017
I met a similar issue: the data loader stops when I finish an epoch and will start a new epoch.
 tiancheng-zhi
on 4 May 2017
tiancheng-zhi
on 4 May 2017
Setting num_workers = 0 works. But the program slows down.
tiancheng-zhi
on 4 May 2017
@apaszke have you tried first rebooting the computer and then running the programs? For me, this guarantees the freezing. I just tried 0.12 version, and it's still the same.
One thing I'd like to point out is that I installed the pytorch using pip, as I have a OpenBLAS-linked numpy installed and the MKL from @soumith 's anaconda cloud wouldn't play with it well.
So essentially pytorch is using MKL and numpy is using OpenBLAS. This may not be ideal, but I think this should have nothing to do with the issue here.
zym1010
on 9 May 2017
I looked into it, but I could never reproduce it. MKL/OpenBLAS should be unrelated to this problem. It's probably some problem with a system configuration
apaszke
on 9 May 2017
@apaszke thanks. I just tried the python from anaconda official repo and MKL based pytorch. Still the same problem.
zym1010
on 9 May 2017
tried running the code in Docker. Still stuck.
zym1010
on 11 May 2017
We have the same problem, running the pytorch/examples imagenet training example (resnet18, 4 workers) inside an nvidia-docker using 1 GPU out of 4. I'll try to gather a gdb backtrace, if I manage to get to the process.
At least OpenBLAS is known to have a deadlock issue in matrix multiplication, which occurs relatively rarely: https://github.com/xianyi/OpenBLAS/issues/937. This bug was present at least in OpenBLAS packaged in numpy 1.12.0.
 jsainio
on 7 Jun 2017
jsainio
on 7 Jun 2017
@jsainio I also tried pure MKL based PyTorch (numpy is linked with MKL as well), and same problem.
Also, this problem is solved (at least for me), if I turn of pin_memory for dataloader.
zym1010
on 7 Jun 2017
It looks as if two of the workers die out.
During normal operation:
root@b06f896d5c1d:~/mnt# ps aux
USER       PID %CPU %MEM    VSZ   RSS TTY      STAT START   TIME COMMAND
user+        1 33.2  4.7 91492324 3098288 ?    Ssl  10:51   1:10 python -m runne
user+       58 76.8  2.3 91079060 1547512 ?    Rl   10:54   1:03 python -m runne
user+       59 76.0  2.2 91006896 1484536 ?    Rl   10:54   1:02 python -m runne
user+       60 76.4  2.3 91099448 1559992 ?    Rl   10:54   1:02 python -m runne
user+       61 79.4  2.2 91008344 1465292 ?    Rl   10:54   1:05 python -m runne
after locking up:
root@b06f896d5c1d:~/mnt# ps aux
USER       PID %CPU %MEM    VSZ   RSS TTY      STAT START   TIME COMMAND
user+        1 24.8  4.4 91509728 2919744 ?    Ssl  14:25  13:01 python -m runne
user+       58 51.7  0.0      0     0 ?        Z    14:27  26:20 [python] <defun
user+       59 52.1  0.0      0     0 ?        Z    14:27  26:34 [python] <defun
user+       60 52.0  2.4 91147008 1604628 ?    Sl   14:27  26:31 python -m runne
user+       61 52.0  2.3 91128424 1532088 ?    Sl   14:27  26:29 python -m runne
For one still remaining workers, the beginning of the gdb stacktrace looks like:
root@b06f896d5c1d:~/mnt# gdb --pid 60
GNU gdb (GDB) 8.0
Attaching to process 60
[New LWP 65]
[Thread debugging using libthread_db enabled]
Using host libthread_db library "/lib/x86_64-linux-gnu/libthread_db.so.1".
0x00007f36f52af827 in do_futex_wait.constprop ()
   from /lib/x86_64-linux-gnu/libpthread.so.0

(gdb) bt
#0  0x00007f36f52af827 in do_futex_wait.constprop ()
   from /lib/x86_64-linux-gnu/libpthread.so.0
#1  0x00007f36f52af8d4 in __new_sem_wait_slow.constprop.0 ()
   from /lib/x86_64-linux-gnu/libpthread.so.0
#2  0x00007f36f52af97a in sem_wait@@GLIBC_2.2.5 ()
   from /lib/x86_64-linux-gnu/libpthread.so.0
#3  0x00007f36f157efb1 in semlock_acquire (self=0x7f3656296458,
    args=<optimized out>, kwds=<optimized out>)
    at /home/ilan/minonda/conda-bld/work/Python-3.5.2/Modules/_multiprocessing/semaphore.c:307
#4  0x00007f36f5579621 in PyCFunction_Call (func=
    <built-in method __enter__ of _multiprocessing.SemLock object at remote 0x7f3656296458>, args=(), kwds=<optimized out>) at Objects/methodobject.c:98
#5  0x00007f36f5600bd5 in call_function (oparg=<optimized out>,
    pp_stack=0x7f36c7ffbdb8) at Python/ceval.c:4705
#6  PyEval_EvalFrameEx (f=<optimized out>, throwflag=<optimized out>)
    at Python/ceval.c:3236
#7  0x00007f36f5601b49 in _PyEval_EvalCodeWithName (_co=<optimized out>,
    globals=<optimized out>, locals=<optimized out>, args=<optimized out>,
    argcount=1, kws=0x0, kwcount=0, defs=0x0, defcount=0, kwdefs=0x0,
    closure=0x0, name=0x0, qualname=0x0) at Python/ceval.c:4018
#8  0x00007f36f5601cd8 in PyEval_EvalCodeEx (_co=<optimized out>,
    globals=<optimized out>, locals=<optimized out>, args=<optimized out>,
    argcount=<optimized out>, kws=<optimized out>, kwcount=0, defs=0x0,
    defcount=0, kwdefs=0x0, closure=0x0) at Python/ceval.c:4039
#9  0x00007f36f5557542 in function_call (
    func=<function at remote 0x7f36561c7d08>,
    arg=(<Lock(release=<built-in method release of _multiprocessing.SemLock object at remote 0x7f3656296458>, acquire=<built-in method acquire of _multiprocessing.SemLock object at remote 0x7f3656296458>, _semlock=<_multiprocessing.SemLock at remote 0x7f3656296458>) at remote 0x7f3656296438>,), kw=0x0)
    at Objects/funcobject.c:627
#10 0x00007f36f5524236 in PyObject_Call (
    func=<function at remote 0x7f36561c7d08>, arg=<optimized out>,
    kw=<optimized out>) at Objects/abstract.c:2165
#11 0x00007f36f554077c in method_call (
    func=<function at remote 0x7f36561c7d08>,
    arg=(<Lock(release=<built-in method release of _multiprocessing.SemLock object at remote 0x7f3656296458>, acquire=<built-in method acquire of _multiprocessing.SemLock object at remote 0x7f3656296458>, _semlock=<_multiprocessing.SemLock at remote 0x7f3656296458>) at remote 0x7f3656296438>,), kw=0x0)
    at Objects/classobject.c:330
#12 0x00007f36f5524236 in PyObject_Call (
    func=<method at remote 0x7f36556f9248>, arg=<optimized out>,
    kw=<optimized out>) at Objects/abstract.c:2165
#13 0x00007f36f55277d9 in PyObject_CallFunctionObjArgs (
    callable=<method at remote 0x7f36556f9248>) at Objects/abstract.c:2445
#14 0x00007f36f55fc3a9 in PyEval_EvalFrameEx (f=<optimized out>,
    throwflag=<optimized out>) at Python/ceval.c:3107
#15 0x00007f36f5601166 in fast_function (nk=<optimized out>, na=1,
    n=<optimized out>, pp_stack=0x7f36c7ffc418,
    func=<function at remote 0x7f36561c78c8>) at Python/ceval.c:4803
#16 call_function (oparg=<optimized out>, pp_stack=0x7f36c7ffc418)
    at Python/ceval.c:4730
#17 PyEval_EvalFrameEx (f=<optimized out>, throwflag=<optimized out>)
    at Python/ceval.c:3236
#18 0x00007f36f5601b49 in _PyEval_EvalCodeWithName (_co=<optimized out>,
    globals=<optimized out>, locals=<optimized out>, args=<optimized out>,
    argcount=4, kws=0x7f36f5b85060, kwcount=0, defs=0x0, defcount=0,
    kwdefs=0x0, closure=0x0, name=0x0, qualname=0x0) at Python/ceval.c:4018
#19 0x00007f36f5601cd8 in PyEval_EvalCodeEx (_co=<optimized out>,
    globals=<optimized out>, locals=<optimized out>, args=<optimized out>,
    argcount=<optimized out>, kws=<optimized out>, kwcount=0, defs=0x0,
    defcount=0, kwdefs=0x0, closure=0x0) at Python/ceval.c:4039
#20 0x00007f36f5557661 in function_call (
    func=<function at remote 0x7f36e14170d0>,
    arg=(<ImageFolder(class_to_idx={'n04153751': 783, 'n02051845': 144, 'n03461385': 582, 'n04350905': 834, 'n02105056': 224, 'n02112137': 260, 'n03938244': 721, 'n01739381': 59, 'n01797886': 82, 'n04286575': 818, 'n02113978': 268, 'n03998194': 741, 'n15075141': 999, 'n03594945': 609, 'n04099969': 765, 'n02002724': 128, 'n03131574': 520, 'n07697537': 934, 'n04380533': 846, 'n02114712': 271, 'n01631663': 27, 'n04259630': 808, 'n04326547': 825, 'n02480855': 366, 'n02099429': 206, 'n03590841': 607, 'n02497673': 383, 'n09332890': 975, 'n02643566': 396, 'n03658185': 623, 'n04090263': 764, 'n03404251': 568, 'n03627232': 616, 'n01534433': 13, 'n04476259': 868, 'n03495258': 594, 'n04579145': 901, 'n04266014': 812, 'n01665541': 34, 'n09472597': 980, 'n02095570': 189, 'n02089867': 166, 'n02009229': 131, 'n02094433': 187, 'n04154565': 784, 'n02107312': 237, 'n04372370': 844, 'n02489166': 376, 'n03482405': 588, 'n04040759': 753, 'n01774750': 76, 'n01614925': 22, 'n01855032': 98, 'n03903868': 708, 'n02422699': 352, 'n01560419': 1...(truncated), kw={}) at Objects/funcobject.c:627
#21 0x00007f36f5524236 in PyObject_Call (
    func=<function at remote 0x7f36e14170d0>, arg=<optimized out>,
    kw=<optimized out>) at Objects/abstract.c:2165
#22 0x00007f36f55fe234 in ext_do_call (nk=1444355432, na=0,
    flags=<optimized out>, pp_stack=0x7f36c7ffc768,
    func=<function at remote 0x7f36e14170d0>) at Python/ceval.c:5034
#23 PyEval_EvalFrameEx (f=<optimized out>, throwflag=<optimized out>)
    at Python/ceval.c:3275
--snip--
I had similar error log, with the main process stuck on: self.data_queue.get()
For me the problem was that I used opencv as image loader. And the cv2.imread function was hanging indefinitely without error on a particular image of imagenet ("n01630670/n01630670_1010.jpeg")
If you said it's working for you with num_workers = 0 it's not that. But I thought it might help some people with similar error trace.
 M-Eng
on 9 Jun 2017
M-Eng
on 9 Jun 2017
I'm running a test with num_workers = 0 currently, no hangs yet. I'm running the example code from https://github.com/pytorch/examples/blob/master/imagenet/main.py. pytorch/vision ImageFolder seems to use PIL or pytorch/accimage internally to load the images, so there's no OpenCV involved.
With num_workers = 4, I can occasionally get the first epoch train and validate fully, and it locks up in the middle of the second epoch. So, it is unlikely a problem in the dataset/loading function.
It looks something like a race condition in ImageLoader which might be triggered relatively rarely by a certain hardware/software combination.
jsainio
on 9 Jun 2017
@zym1010 thanks for the pointer, I'll try setting pin_memory = False too for the DataLoader.
jsainio
on 9 Jun 2017
Interesting. On my setup, setting pin_memory = False and num_workers = 4 the imagenet example hangs almost immediately and three of the workers end up as zombie processes:
root@034c4212d022:~/mnt# ps aux
USER       PID %CPU %MEM    VSZ   RSS TTY      STAT START   TIME COMMAND
user+        1  6.7  2.8 92167056 1876612 ?    Ssl  13:50   0:36 python -m runner
user+       38  1.9  0.0      0     0 ?        Z    13:51   0:08 [python] <defunct>
user+       39  4.3  2.3 91069804 1550736 ?    Sl   13:51   0:19 python -m runner
user+       40  2.0  0.0      0     0 ?        Z    13:51   0:09 [python] <defunct>
user+       41  4.1  0.0      0     0 ?        Z    13:51   0:18 [python] <defunct>
In my setup, the dataset lies on a networked disk that is read over NFS. With pin_memory = False and num_workers = 4 I can get the system fail fairly fast.
=> creating model 'resnet18'
- training epoch 0
Epoch: [0][0/5005]  Time 10.713 (10.713)    Data 4.619 (4.619)  Loss 6.9555 (6.9555)    Prec@1 0.000 (0.000)    Prec@5 0.000 (0.000)
Traceback (most recent call last):
--snip--
imagenet_pytorch.main.main([data_dir, "--transient_dir", context.transient_dir])
  File "/home/user/mnt/imagenet_pytorch/main.py", line 140, in main

train(train_loader, model, criterion, optimizer, epoch, args)
  File "/home/user/mnt/imagenet_pytorch/main.py", line 168, in train

for i, (input, target) in enumerate(train_loader):
  File "/home/user/anaconda/lib/python3.5/site-packages/torch/utils/data/dataloader.py", line 206, in __next__

idx, batch = self.data_queue.get()
  File "/home/user/anaconda/lib/python3.5/multiprocessing/queues.py", line 345, in get

return ForkingPickler.loads(res)
  File "/home/user/anaconda/lib/python3.5/site-packages/torch/multiprocessing/reductions.py", line 70, in rebuild_storage_fd

fd = df.detach()
  File "/home/user/anaconda/lib/python3.5/multiprocessing/resource_sharer.py", line 57, in detach

with _resource_sharer.get_connection(self._id) as conn:
  File "/home/user/anaconda/lib/python3.5/multiprocessing/resource_sharer.py", line 87, in get_connection

c = Client(address, authkey=process.current_process().authkey)
  File "/home/user/anaconda/lib/python3.5/multiprocessing/connection.py", line 493, in Client

answer_challenge(c, authkey)
  File "/home/user/anaconda/lib/python3.5/multiprocessing/connection.py", line 732, in answer_challenge

message = connection.recv_bytes(256)         # reject large message
  File "/home/user/anaconda/lib/python3.5/multiprocessing/connection.py", line 216, in recv_bytes

buf = self._recv_bytes(maxlength)
  File "/home/user/anaconda/lib/python3.5/multiprocessing/connection.py", line 407, in _recv_bytes

buf = self._recv(4)
  File "/home/user/anaconda/lib/python3.5/multiprocessing/connection.py", line 379, in _recv

chunk = read(handle, remaining)
ConnectionResetError
:
[Errno 104] Connection reset by peer
@zym1010 do you happen to have a networked disk or a traditional spinning disk as well which might be slower in latency/etc.?
jsainio
on 9 Jun 2017
@jsainio
I'm using a local SSD on the compute node of cluster.The code is on a NFS drive, but the data is on the local SSD, for maximal loading speed. Never tried loading data on NFS drives.
zym1010
on 9 Jun 2017
@zym1010 Thanks for the info. I'm running this too on a compute node of a cluster.
Actually, I'm running the num_workers = 0 experiment on the same node at the same time while trying the num_workers = 4 variations. It might be that the first experiment is generating enough load so that possible race conditions manifest themselves faster in the latter.
jsainio
on 9 Jun 2017
@apaszke When you tried to reproduce this previously, did you happen to try running two instances side-by-side or with some significant other load on the system?
jsainio
on 9 Jun 2017
@jsainio Thanks for investigating this! That's weird, workers should only exit together, and once the main process is done reading the data. Can you try to inspect why do they exit prematurely? Maybe check the kernel log (dmesg)?
apaszke
on 9 Jun 2017
No, I haven't tried that, but it seemed to appear even when that wasn't the case IIRC
apaszke
on 9 Jun 2017
@apaszke Ok, good to know that the workers should not have exited.
I've tried but I don't know a good way to check why they exit. dmesg does not show anything relevant. (I'm running in a Ubuntu 16.04-derived Docker, using Anaconda packages)
jsainio
on 9 Jun 2017
One way would be to add a number of prints inside the worker loop. I have no idea why do they silently exit. It's probably not an exception, because it would have been printed to stderr, so they either break out of the loop, or get killed by the OS (perhaps by a signal?)
apaszke
on 9 Jun 2017
@jsainio, just to make sure, are you running docker with --ipc=host (you don't mention this)? Can you check the size of your shared memory segment (df -h | grep shm)?
ngimel
on 9 Jun 2017
@ngimel I'm using --shm-size=1024m. df -h | grep shm reports accordingly:
root@db92462e8c19:~/mnt# df -h | grep shm
shm                                                          1.0G  883M  142M  87% /dev/shm
That usage seems rather high tough. This is on a docker with two zombie workers.
jsainio
on 12 Jun 2017
Can you try increasing shm size? I just checked and on the server where I tried to reproduce the problems it was 16GB. You either change the docker flag or run
mount -o remount,size=8G /dev/shm
I just tried decreasing the size to 512MB, but I got a clear error instead of a deadlock. Still can't reproduce 😕
apaszke
on 14 Jun 2017
With docker we tend to get deadlocks when shm is not enough, rather than clear error messages, don't know why. But it is usually cured by increasing shm (and I did get deadlocks with 1G).
ngimel
on 14 Jun 2017
Ok, it seems that with 10 workers an error is raised, but when I use 4 workers I get a deadlock at 58% of /dev/shm usage! I finally reproduced it
apaszke
on 14 Jun 2017
That's great that you can reproduce a form of this problem. I posted a script that triggers a hang in #1579, and you replied that it didn't hang on your system. I had actually only tested it on my MacBook. I just tried on Linux, and it didn't hang. So if you only tried on Linux, it might also be worth trying on a Mac.
 greaber
on 14 Jun 2017
greaber
on 14 Jun 2017
Ok, so after investigating the problem it seems to be a weird issue. Even when I limit /dev/shm to be only 128MB large, Linux is happy to let us create 147MB files there, mmap them fully in memory, but will send a deadly SIGBUS to the worker once it actually tries to access the pages... I can't think of any mechanism that would allow us to check validity of the pages except for iterating over them, and touching each one, with a SIGBUS handler registered...
A workaround for now is to expand /dev/shm with the mount command as I shown above. Try with 16GB (ofc if you have enough RAM).
apaszke
on 15 Jun 2017
It's hard to find any mentions of this, but here's one.
apaszke
on 15 Jun 2017
Thanks for your time about this issue, it has been driving me nuts for a long time! If I understand correctly I need to expand /dev/shm to be 16G instead of 8G. It makes sens but when when in try df -h, I can see that all my ram is actually allocated as such : (I have 16G)
tmpfs              7,8G    393M  7,4G   5% /dev/shm
tmpfs              5,0M    4,0K  5,0M   1% /run/lock
tmpfs              7,8G       0  7,8G   0% /sys/fs/cgroup
tmpfs              1,6G     60K  1,6G   1% /run/user/1001
This is the output of df -h during a deadlock. As far as I understand, If I have a SWAP partition of 16G, I can mount tmpfs up to 32G, so it shouldn't be a problem to expand /dev/shm, right ?
More importantly, I am puzzled about the cgroup partition and its purpose since it takes nearly a half of my RAM. Apparently it's designed to manage efficiently multi-processor tasks, but I'm really not familiar with what it does and why we need it, would it change something to allocate all of physical RAM to shm (because we set its size to 16G) and put it in SWAP (although i believe both will be partly in the RAM and SWAP simultaneously)
 ClementPinard
on 15 Jun 2017
ClementPinard
on 15 Jun 2017
@apaszke Thanks! Great that you found the underlying cause. I was occasionally getting both various "ConnectionReset" errors and deadlocks with docker --shm-size=1024m depending what other load there was one the machine. Testing now with --shm-size=16384m and 4 workers.
jsainio
on 15 Jun 2017
@jsainio ConnectionReset might have been caused by the same thing. The processes started exchanging some data, but once shm ran out of space a SIGBUS was sent to the worker and killed it.
@ClementPinard as far as I understand you can make it as large as you want, except that it will likely freeze your machine once you run out of RAM (because even kernel can't free this memory). You probably don't need to bother about /sys/fs/cgroup. tmpfs partitions allocate memory lazily, so as long as the usage stays at 0B, it doesn't cost you anything (including limits). I don't think using swap is a good idea, as it will make the data loading muuuuch slower, so you can try increasing the shm size to say 12GB, and limiting the number of workers (as I said, don't use all your RAM for shm!). Here's a nice writeup on tmpfs from the kernel documentation.
I don't know why the deadlock happen even when /dev/shm usage is very small (happens at 20kB on my machine). Perhaps the kernel is overly optimistic, but doesn't wait until you fill it all, and kills the process once it starts using anything from this region.
apaszke
on 15 Jun 2017
Testing now with 12G and half the workers I had, and it failed :(
It was working like a charm in lua torch version (same speed, same number of workers) , which makes me wonder if the problem is only /dev/shmrelated and not closer to python multiprocessing...
The odd thing about it (as you mentionned) is that /dev/shmis never close to be full. During first training epoch, it never went above 500Mo. And It also never locks during first epoch, and if I shut down testing trainloader never fails across all the epochs. The deadlock seems to only appear when beginning test epoch. I should keep track of /dev/shm when going from train to test, maybe there is a peak usage during dataloaders changing.
ClementPinard
on 15 Jun 2017
@ClementPinard even with higher shared memory, and without Docker, it can still fail.
zym1010
on 15 Jun 2017
If torch version == Lua Torch, then it still might be related to /dev/shm. Lua Torch can use threads (there's no GIL), so it doesn't need to go through shared mem (they all share a single address space).
apaszke
on 15 Jun 2017
I had the same issue where the dataloader crashes after complaining that it could not allocate memory at the beginning of a new training or validation epoch. The solutions above did not work for me (i) my /dev/shm is 32GB and it was never used more than 2.5GB, and (ii) setting pin_memory=False did not work.
This is perhaps something to do with garbage collection? My code looks roughly like the following. I need an infinite iterator and hence I do a try / except around the next() below :-)
def train():
    train_iter = train_loader.__iter__()
    for i in xrange(max_batches):
        try:
            x, y = next(train_iter)
        except StopIteration:
            train_iter = train_loader.__iter__()
        ...
    del train_iter
train_loader is a DataLoader object. Without the explicit del train_iter line at the end of the function, the process always crashes after 2-3 epochs (/dev/shm still shows 2.5 GB). Hope this helps!
I am using 4 workers (version 0.1.12_2 with CUDA 8.0 on Ubuntu 16.04).
 pratikac
on 7 Jul 2017
pratikac
on 7 Jul 2017
I also met the deadlock, especially when the work_number is large. Is there any possible solution for this problem? My /dev/shm size is 32GB, with cuda 7.5, pytorch 0.1.12 and python 2.7.13. The following is related info after death. It seems related to memory. @apaszke

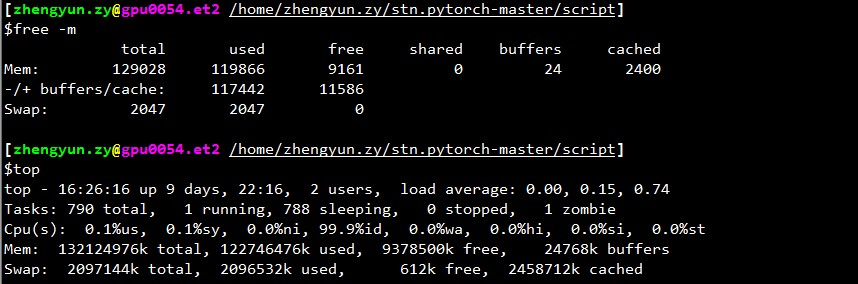
 zhengyunqq
on 4 Aug 2017
zhengyunqq
on 4 Aug 2017
@zhengyunqq try pin_memory=False if you set it to True. Otherwise, I'm not aware of any solution.
zym1010
on 4 Aug 2017
I have also met the deadlock when num_workers is large.
 hendrycks
on 11 Aug 2017
hendrycks
on 11 Aug 2017
For me, the problem was that if a worker thread dies for whatever reason, then index_queue.put hangs forever. One reason of working threads dying is unpickler failing during initialization. In that case, until this Python bugfix in master in May 2017, the worker thread would die and cause the endless hang. In my case, the hang was happening in batch pre-fetching priming stage.
Maybe a replacement of SimpleQueue used in DataLoaderIter by Queue which allows for a timeout with a graceful exception message.
UPD: I was mistaken, this bugfix patches Queue, not SimpleQueue. It's still true that SimpleQueue will lock if no worker threads are online. An easy way to check that is replacing these lines with self.workers = [].
 vadimkantorov
on 16 Aug 2017
vadimkantorov
on 16 Aug 2017
i have the same problem, and i can't change shm(without permission), maybe it's better to use Queue or something else?
 xfanplus
on 8 Sep 2017
xfanplus
on 8 Sep 2017
I have a similar problem.
This code will freeze and never print anything. If I set num_workers=0 it will work though
dataloader = DataLoader(transformed_dataset, batch_size=2, shuffle=True, num_workers=2)
model.cuda()
for i, batch in enumerate(dataloader):
 print(i)
If I put model.cuda() behind the loop, everything will run fine.
dataloader = DataLoader(transformed_dataset, batch_size=2, shuffle=True, num_workers=2)

for i, batch in enumerate(dataloader):
 print(i)
model.cuda()
Does anyone have a solution for that problem?
 anDoer
on 13 Sep 2017
anDoer
on 13 Sep 2017
I have run into similar issues as well while training ImageNet. It will hang at the 1st iteration of evaluation consistently on certain servers with certain architecture (and not on other servers with the same architecture or the same server with different architecture), but always the 1st iter during eval on validation. When I was using Torch, we found nccl can cause deadlock like this, is there way to turn it off?
 WendyShang
on 20 Sep 2017
WendyShang
on 20 Sep 2017
I'm facing the same issue,randomly getting stuck at the start of 1st epoch.All the workarounds mentioned above don't work for me.When Ctrl-C is pressed, it prints these:
Traceback (most recent call last):
  File "/home/zhangheng_li/applications/anaconda3/lib/python3.6/multiprocessing/process.py", line 249, in _bootstrap
    self.run()
  File "/home/zhangheng_li/applications/anaconda3/lib/python3.6/multiprocessing/process.py", line 93, in run
    self._target(*self._args, **self._kwargs)
  File "/home/zhangheng_li/applications/anaconda3/lib/python3.6/site-packages/torch/utils/data/dataloader.py", line 44, in _worker_loop
    data_queue.put((idx, samples))
  File "/home/zhangheng_li/applications/anaconda3/lib/python3.6/multiprocessing/queues.py", line 354, in put
    self._writer.send_bytes(obj)
  File "/home/zhangheng_li/applications/anaconda3/lib/python3.6/multiprocessing/connection.py", line 200, in send_bytes
    self._send_bytes(m[offset:offset + size])
  File "/home/zhangheng_li/applications/anaconda3/lib/python3.6/multiprocessing/connection.py", line 398, in _send_bytes
    self._send(buf)
  File "/home/zhangheng_li/applications/anaconda3/lib/python3.6/multiprocessing/connection.py", line 368, in _send
    n = write(self._handle, buf)
KeyboardInterrupt
Traceback (most recent call last):
  File "scripts/train_model.py", line 640, in <module>
    main(args)
  File "scripts/train_model.py", line 193, in main
    train_loop(args, train_loader, val_loader)
  File "scripts/train_model.py", line 341, in train_loop
    ee_optimizer.step()
  File "/home/zhangheng_li/applications/anaconda3/lib/python3.6/site-packages/torch/optim/adam.py", line 74, in step
    p.data.addcdiv_(-step_size, exp_avg, denom)
KeyboardInterrupt
 zoharli
on 23 Oct 2017
zoharli
on 23 Oct 2017
I had a similar problem of having a deadlock with a single worker inside docker and I can confirm that it was the shared memory issue in my case. By default docker only seems to allocate 64MB of shared memory, however I needed 440MB for 1 worker, which probably caused the behavior described by @apaszke.
 paulguerrero
on 23 Oct 2017
paulguerrero
on 23 Oct 2017
I am being troubled by the same problem, yet I'am under a different environment from most others in this thread, so maybe my inputs can help locating the underlying cause. My pytorch is installed using the excellent conda package built by peterjc123 under Windows10.
I am running some cnn on the cifar10 dataset. For the dataloaders, num_workers is set to 1. Although having num_workers > 0 is known to cause BrokenPipeError and advised against in #494, what I am experiencing is not BrokenPipeError but some memory allocation error. The error always occurred at around 50 epochs, right after the validation of the last epoch and before the start of training for the next epoch. 90% of the time it's precisely 50 epochs, other times it will be off by 1 or 2 epochs. Other than that everything else is pretty consistent. Setting num_workers=0 will eliminate this problem.
 berzjackson
on 24 Oct 2017
berzjackson
on 24 Oct 2017
@paulguerrero is right. I solved this problem by increasing the shared memory from 64M to 2G. Maybe it's useful to docker users.
 yjzhux
on 24 Oct 2017
yjzhux
on 24 Oct 2017
@berzjackson That's a known bug in the conda package. Fixed in the latest CI builds.
 peterjc123
on 25 Oct 2017
peterjc123
on 25 Oct 2017
We have ~600 people that started a new course that uses Pytorch on Monday. A lot of folks on our forum are reporting this problem. Some on AWS P2, some on their own systems (mainly GTX 1070, some Titan X).
When they interrupt training the end of the stack trace shows:
~/anaconda2/envs/fastai/lib/python3.6/multiprocessing/connection.py in _recv_bytes(self, maxsize)
    405
    406     def _recv_bytes(self, maxsize=None):
--> 407         buf = self._recv(4)
    408         size, = struct.unpack("!i", buf.getvalue())
    409         if maxsize is not None and size > maxsize:

~/anaconda2/envs/fastai/lib/python3.6/multiprocessing/connection.py in _recv(self, size, read)
    377         remaining = size
    378         while remaining > 0:
--> 379             chunk = read(handle, remaining)
    380             n = len(chunk)
    381             if n == 0:
We have num_workers=4, pin_memory=False. I've asked them to check their shared memory settings - but is there anything I can do (or we could do in Pytorch) to make this problem go away? (Other than reducing num_workers, since that would slow things down quite a bit.)
 jph00
on 1 Nov 2017
jph00
on 1 Nov 2017
I'm in the class @jph00 (thanks Jeremy! :) ) referred to. I tried using "num_workers=0" as well. Still get the same error where resnet34 loads very slowly. The fitting is also very slow. But weird thing: this only happens once in the lifetime of a notebook session.
In other words, once the data is loaded, and the fitting is run once, I can move around and keep repeating the steps... even with 4 num_workers, and everything seems to work fast as expected in a GPU.
I'm on PyTorch 0.2.0_4, Python 3.6.2, Torchvision 0.1.9, Ubuntu 16.04 LTS. Doing "df -h" on my terminal says that I've 16GBs on /dev/shm, although the utilization was very low.
Here's a screenshot of where the loading fails (note I've used num_workers=0 for the data)
(sorry about the small letters. I had to zoom out to capture everything...)

 apiltamang
on 1 Nov 2017
apiltamang
on 1 Nov 2017
@apiltamang I'm not sure that's the same issue - it doesn't sound like the same symptoms at all. Best for us to diagnose that on the fast.ai forum, not here.
jph00
on 1 Nov 2017
looking into this ASAP!
 soumith
on 1 Nov 2017
soumith
on 1 Nov 2017
@soumith I've given @apaszke access to the course's private forum and I've asked students with the problem to give us access to login to their box.
jph00
on 1 Nov 2017
@jph00 Hi Jeremy, did any of the students try increasing shm as @apaszke mentioned above? Was that helpful?
 SsnL
on 1 Nov 2017
SsnL
on 1 Nov 2017
@SsnL one of the students has confirmed they've increased shared memory, and still have the problem. I've asked some others to confirm too.
jph00
on 1 Nov 2017
@jph00 Thanks! I successfully reproduced the hang due to low shared memory. If the issue lies in elsewhere I'll have to dig deeper! Do you mind share the script with me?
SsnL
on 1 Nov 2017
Sure - here's the notebook we're using: https://github.com/fastai/fastai/blob/master/courses/dl1/lesson1.ipynb . The students have noticed that the problem only occurs when they run all the cells in the order they're in the notebook. Hopefully the notebook is self-explanatory, but let me know if you have any trouble running it - it includes a link to download the necessary data.
Based on the shared memory issue you could replicate, is there any kind of workaround I could add to our library or notebook that would avoid it?
jph00
on 1 Nov 2017
@jph00 Diving into the code right now. I'll try to spot ways to reduce shared memory usage. It doesn't seem that the script should use large amount of shm, so there is hope!
I'll also send out a PR to show a nice error message upon hitting shm limit rather than just letting it hang.
SsnL
on 1 Nov 2017
OK I've replicated the problem on a fresh AWS P2 instance using their CUDA 9 AMI with latest Pytorch conda install. If you provide your public key, I can give you access to try it out directly. My email is the first letter of my first name at fast.ai
jph00
on 1 Nov 2017
@jph00 Just sent you an email :) thanks!
SsnL
on 1 Nov 2017
@jph00 And FYI, the script took 400MB shared memory on my box. So it'd be great for students who had this issue to check they have enough free shm.
SsnL
on 1 Nov 2017
OK so I've figured out the basic issue, which is that opencv and Pytorch multiprocessing don't play well together, sometimes. No problems on our box at university, but lots of problems on AWS (on the new deep learning CUDA 9 AMI with P2 instance). Adding locking around all cv2 calls doesn't fix it, and adding cv2.setNumThreads(0) doesn't fix. This seems to fix it:
from multiprocessing import set_start_method
set_start_method('spawn')
However that impacts performance by about 15%. The recommendation in the opencv github issue is to use https://github.com/tomMoral/loky . I've used that module before and found it rock-solid. Not urgent, since we've got a solution that works well enough for now - but might be worth considering using Loky for Dataloader?
Perhaps more importantly, it would be nice if at least there was some kind of timeout in pytorch's queue so that these infinite hangs would get caught.
jph00
on 2 Nov 2017
FYI, I just tried a different fix, since 'spawn' was making some parts 2-3x slower - which is that I added a few random sleeps in sections that iterate through the dataloader quickly. That also fixed the problem - although perhaps not ideal!
jph00
on 2 Nov 2017
Thanks for digging into this! Glad to know that you've found two workarounds. Indeed it would be good to add timeouts on indexing into datasets. We will discuss and get back to you on that route tomorrow.
cc @soumith is loky something we want to investigate?
SsnL
on 2 Nov 2017
For people who come to this thread for above discussion, the opencv issue is discussed in greater depth at https://github.com/opencv/opencv/issues/5150
SsnL
on 2 Nov 2017
OK I seem to have a proper fix for this now - I've rewritten Dataloader to user ProcessPoolExecutor.map() and moved the creation of the tensor into the parent process. The result is faster than I was seeing with the original Dataloader, and it's been stable on all the computers I've tried it on. The code is also a lot simpler.
If anyone is interested in using it, you can get it from https://github.com/fastai/fastai/blob/master/fastai/dataloader.py .
The API is the same as the standard version, except that your Dataset must not return a Pytorch tensor - it should return numpy arrays or python lists. I haven't made any attempt to make it work on older Pythons, so I wouldn't be surprised if there's some issues there.
(The reason I've gone down this path is that I found when doing a lot of image processing/augmentation on recent GPUs that I couldn't complete the processing fast enough to keep the GPU busy, if I did the preprocessing using Pytorch CPU operations; however using opencv was much faster, and I was able to fully utilize the GPU as a result.)
jph00
on 2 Nov 2017
Oh if it's an opencv issue then there's not a lot we can do about it. It's true that forking is dangerous when you have thread pools. I don't think we want to add a runtime dependency (currently we have none), especially that it won't handle PyTorch tensors nicely. It would be better to just figure out what's causing the deadlocks and @SsnL is on it.
@jph00 have you tried Pillow-SIMD? It should work with torchvision out of the box and I have heard many good things about it.
apaszke
on 2 Nov 2017
Yes I know pillow-SIMD well. It only speeds up resize, blur, and RGB conversion.
I don't agree there's not a lot you can do here. It's not exactly an opencv issue (they don't claim to support this type of python multiprocessing more generally, let alone pytorch's special-cased multi-processing module) and not exactly a Pytorch issue either. But the fact that Pytorch silently waits for ever without giving any kind of error is (IMO) something you can fix, and more generally a lot of smart folks have been working hard over the last few years to create improved multiprocessing approaches which avoid problems just like this one. You could borrow from the approaches they use without bringing in an external dependency.
Olivier Grisel, who is one of the folks behind Loky, has a great slide deck summarizing the state of multiprocessing in Python: http://ogrisel.github.io/decks/2017_euroscipy_parallelism/
I don't mind either way, since I've now written a new Dataloader that doesn't have the problem. But I do, FWIW, suspect that interactions between pytorch's multiprocessing and other systems will be an issue for other folks too in the future.
jph00
on 2 Nov 2017
For what it's worth, I had this issue on Python 2.7 on ubuntu 14.04. My data loader read from a sqlite database and worked perfectly with num_workers=0, sometimes seemed OK with num_workers=1, and very quickly deadlocked for any higher value. Stack traces showed the process hung in recv_bytes.
Things that didn't work:
- Passing
--shm-size 8Gor--ipc=hostwhen launching docker - Running
echo 16834 | sudo tee /proc/sys/kernel/shmmnito increase the number of shared memory segments (the default was 4096 on my machine) - Setting
pin_memory=Trueorpin_memory=False, neither one helped
The thing that reliably fixed my issue was porting my code to Python 3. Launching the same version of Torch inside a Python 3.6 instance (from Anaconda) completely fixed my issue and now data loading doesn't hang anymore.
 gcr
on 16 Nov 2017
gcr
on 16 Nov 2017
@apaszke here's why working well with opencv is important, FYI (and why torchsample isn't a great option - it can handle rotation of <200 images/sec!):
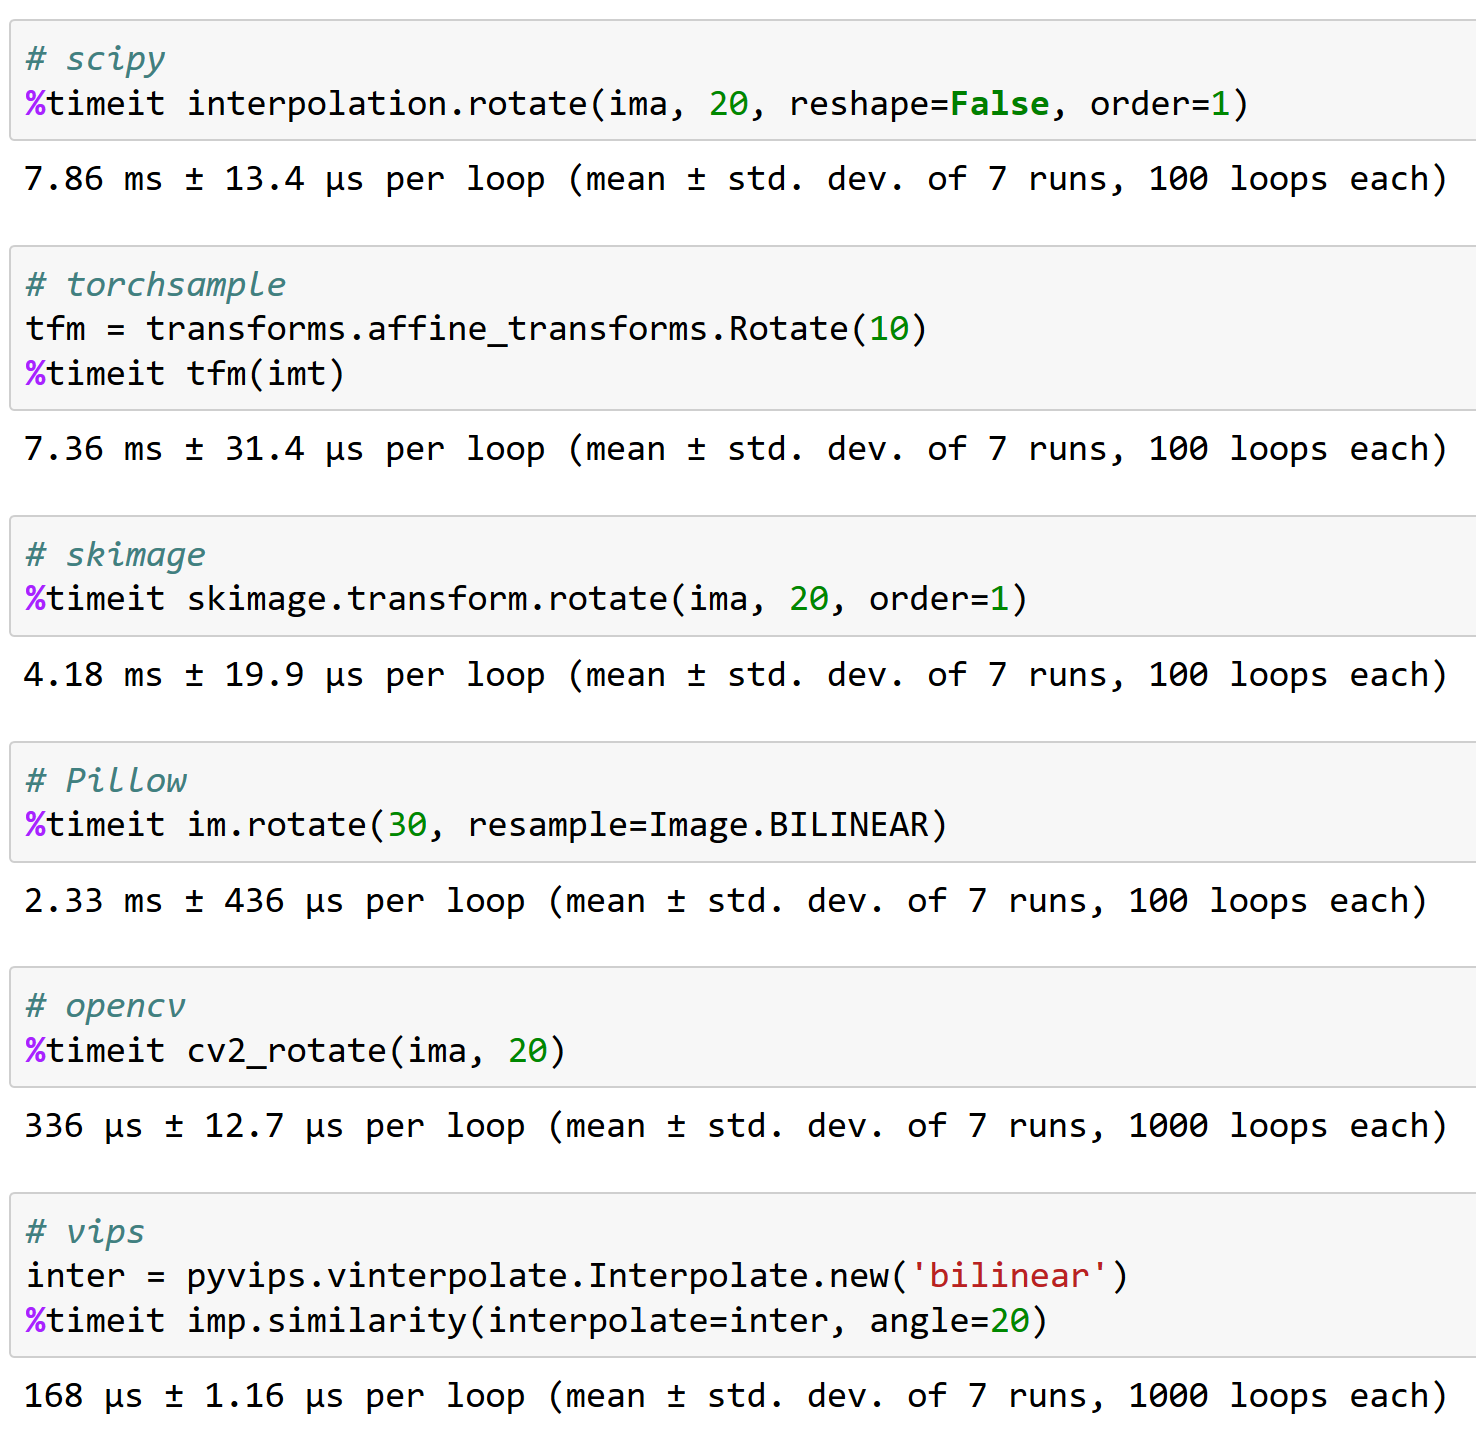
jph00
on 18 Nov 2017
Did anyone find a solution to this problem?
 iqbalu
on 9 Dec 2017
iqbalu
on 9 Dec 2017
@iqbalu Try the script above: https://github.com/fastai/fastai/blob/master/fastai/dataloader.py
It solved my issue but it doesn't support num_workers=0.
 elbaro
on 14 Dec 2017
elbaro
on 14 Dec 2017
@elbaro actually I tried it and in my case it was not using multiple workers at all. Did you change anything there?
iqbalu
on 14 Dec 2017
@iqbalu fast.ai data loader never spawns worker processes. It only uses threads, so they might not show up in some tools
apaszke
on 14 Dec 2017
@apaszke @elbaro @jph00 The data loader from fast.ai slowed down data reading by more than 10x. I am using num_workers=8. Any hint what could be the reason?
iqbalu
on 15 Dec 2017
It's likely data loader uses packages that don't give up the GIL
apaszke
on 15 Dec 2017
@apaszke any idea why the usage of shared-memory keeps increasing after some epochs. In my case, it starts with 400MB and then every ~20th epoch increases by 400MB. Thanks!
iqbalu
on 28 Dec 2017
@iqbalu not really. That shouldn't be happening
apaszke
on 28 Dec 2017
I tried many things and cv2.setNumThreads(0) finally solved my issue.
Thanks @jph00
 Cadene
on 19 Jan 2018
Cadene
on 19 Jan 2018
I have been troubled by this problem recently. cv2.setNumThreads(0) doesn't work for me. I even change all cv2 code to use scikit-image instead, but the problem still exists. Besides, I have 16G for /dev/shm. I only have this problem when using multiple gpus. Every thing works fine on single gpu. Do anyone has any new thoughts on the solution?
 roytseng-tw
on 25 Jan 2018
roytseng-tw
on 25 Jan 2018
Same Error. I have this problem when using single gpu.
 Jiankai-Sun
on 27 Jan 2018
Jiankai-Sun
on 27 Jan 2018
For me disabling opencv threads solved the problem:
cv2.setNumThreads(0)
 shacharf
on 28 Jan 2018
shacharf
on 28 Jan 2018
hit it too with pytorch 0.3, cuda 8.0, ubuntu 16.04
no opencv used.
 tianq01
on 1 Feb 2018
tianq01
on 1 Feb 2018
I am using pytorch 0.3, cuda 8.0, ubuntu 14.04. Observed this hang after I started using cv2.resize()
cv2.setNumThreads(0) solved my issue.
 mathmanu
on 9 Feb 2018
mathmanu
on 9 Feb 2018
I am using python 3.6, pytorch 0.3.0, cuda 8.0 and ubuntu 17.04 on a system with two 1080Ti and 32GB RAM.
When I use 8 workers for my own dataset, I frequently see the deadlock (it happens in the first epoch). When I reduce the workers to 4, it disappears (I ran 80 epochs).
When deadlock happens, I still have ~10GB free on RAM.
 milani
on 2 Mar 2018
milani
on 2 Mar 2018
Here you can see the log after terminating the script: https://gist.github.com/milani/42f50c023cdca407115b309237d29c70
UPDATE: I confirm that I could resolve the issue with increasing SHMMNI . On Ubuntu 17.04, I added kernel.shmmni=8192 to /etc/sysctl.conf.
milani
on 2 Mar 2018
Also experiencing this issue, Ubuntu 17.10, Python 3.6, Pytorch 0.3.1, CUDA 8.0. There's plenty of RAM left when the deadlock occurs and time seems to be inconsistent - can happen after 1-st epoch, or after 200-th.
Combination of kernel.shmmni=8192 and cv2.setNumThreads(0) seems to have remedied it, whereas they didn't work individually.
 inoryy
on 8 Mar 2018
inoryy
on 8 Mar 2018
Same in my case. I experienced a deadlock if I set up the num_workers=4. I use Ubuntu 17.10, Pytorch 0.3.1, CUDA 9.1, python 3.6. It is observed that there are 4 python threads, each of which occupies 1.6 GB memory while the CPU (4 cores) remains idle. Setting num_workers=0 helps to solve this issue.
 AlenUbuntu
on 27 Mar 2018
AlenUbuntu
on 27 Mar 2018
I've got the same problem, freezes after exactly one epoch, but not really reproducible for smaller datasets. I'm using CUDA 9.1, Pytorch 0.3.1, Python 3.6 in a Docker environment.
I tried @jph00 's Dataloader, however I found it was a lot slower for my usecase. My workaround currently is to recreate the Pytorch DataLoader before every epoch. This seems to work, but is really ugly.
 tfriedel
on 11 Apr 2018
tfriedel
on 11 Apr 2018
I had exactly the same issue on Ubuntu 17.10, CUDA 9.1, Pytorch master (compiled 19/04 morning). Also using OpenCV in my Dataset subclass.
Then I was able to avoid the deadlock by changing the multiprocessing start method from 'forkserver' to 'spawn':
# Set multiprocessing start method - deadlock
set_start_method(forkserver')

# Set multiprocessing start method - runs fine
set_start_method('spawn')
 mfuntowicz
on 19 Apr 2018
mfuntowicz
on 19 Apr 2018
I almost tried all of the above approaches! None of them worked!
This problem might be related to some incompatibilities with the hardware architecture and I do not know how Pytorch may provoke it! It may or may not be the Pytorch problem!
So here's how my problem has been resolved:
_I update the BIOS! After trying all of the aforementioned suggestions!_
Give it a shot. At least that solve my problem.
 astorfi
on 21 Apr 2018
astorfi
on 21 Apr 2018
Same here. Ubuntu PyTorch 0.4, python3.6.
 Shuailong
on 30 Apr 2018
Shuailong
on 30 Apr 2018
It looks like the problem still exists in pytorch 0.4 and python 3.6. Not sure if it is a pytorch problem. I use opencv and set num_workers=8, pin_memory=True. I try all the tricks mentioned above and setting cv2.setNumThreads(0) solves my problem.
 JasonQSY
on 10 May 2018
JasonQSY
on 10 May 2018
(1) Setting num_workers=0 in PyTorch data loading solves the issue (see above) OR
(2) cv2.setNumThreads(0) solves the issue even with reasonably large num_workers
This looks like some kind of thread locking issue.
I set cv2.setNumThreads(0) somewhere towards beginning of my main python file and I have never had this issue since then.
mathmanu
on 10 May 2018
Yes, a lot of those issues are because of third party libraries not being fork safe. One alternative resolution might be to use the spawn start method.
apaszke
on 10 May 2018
For me, the deadlock issue arise when I wrap my model with nn.DataParallel and use num_workers > 0 in the dataloader. By removing the nn.DataParallel wrapper, I can run my script without any locking.
CUDA_VISIBLE_DEVICES=0 python myscript.py --split 1
CUDA_VISIBLE_DEVICES=1 python myscript.py --split 2
Without multiple gpu, my script runs slower but I can run multiple experiments at the same time on different split of the dataset.
 euwern
on 15 Jun 2018
euwern
on 15 Jun 2018
I have same problem on Python 3.6.2 / Pytorch 0.4.0.
and I tried to above all approach switching pin_memory, changing size of shared memory, and i use skiamge library(i am not using cv2!!), but I still have problem.
this problem raise randomly. controlling this problem is just watching console and restarting training.
 slaysd
on 19 Jun 2018
slaysd
on 19 Jun 2018
@jinh574 I just set the number of data loader workers to 0, and it works.
Shuailong
on 19 Jun 2018
@Shuailong I have to use large size image, so i can't use that parameters because of speed. i need to more inspecting about this problem
slaysd
on 19 Jun 2018
I've got the same issue on Python 3.6 / Pytorch 0.4.0. Does pin_memory option affect something?
 ein-farbe
on 26 Jun 2018
ein-farbe
on 26 Jun 2018
If you are using collate_fn, and num_workers>0 with PyTorch version < 0.4:
MAKE SURE YOU DON'T RETURN ZERO DIM TENSORS FROM YOUR __getitem__() FUNCTION.
OR RETURN THEM AS NUMPY ARRAYS.
 pyaf
on 12 Jul 2018
pyaf
on 12 Jul 2018
I have that issue even after setting num_workers=0 or cv2.setNumThreads(0).
It fails with either of these two issues. Any one else facing the same thing?
Traceback (most recent call last):
File "/opt/conda/envs/pytorch-py3.6/lib/python3.6/runpy.py", line 193, in _run_module_as_main
"__main__", mod_spec)
File "/opt/conda/envs/pytorch-py3.6/lib/python3.6/runpy.py", line 85, in _run_code
exec(code, run_globals)
File "/opt/conda/envs/pytorch-py3.6/lib/python3.6/site-packages/torch/distributed/launch.py", line 209, in
main()
File "/opt/conda/envs/pytorch-py3.6/lib/python3.6/site-packages/torch/distributed/launch.py", line 205, in main
process.wait()
File "/opt/conda/envs/pytorch-py3.6/lib/python3.6/subprocess.py", line 1457, in wait
(pid, sts) = self._try_wait(0)
File "/opt/conda/envs/pytorch-py3.6/lib/python3.6/subprocess.py", line 1404, in _try_wait
(pid, sts) = os.waitpid(self.pid, wait_flags)
KeyboardInterrupt
File "/opt/conda/envs/pytorch-py3.6/lib/python3.6/multiprocessing/process.py", line 258, in _bootstrap
self.run()
File "/opt/conda/envs/pytorch-py3.6/lib/python3.6/multiprocessing/process.py", line 93, in run
self._target(self._args, *self._kwargs)
File "/opt/conda/envs/pytorch-py3.6/lib/python3.6/site-packages/torch/utils/data/dataloader.py", line 96, in _worker_loop
r = index_queue.get(timeout=MANAGER_STATUS_CHECK_INTERVAL)
File "/opt/conda/envs/pytorch-py3.6/lib/python3.6/multiprocessing/queues.py", line 104, in get
if not self._poll(timeout):
File "/opt/conda/envs/pytorch-py3.6/lib/python3.6/multiprocessing/connection.py", line 257, in poll
return self._poll(timeout)
File "/opt/conda/envs/pytorch-py3.6/lib/python3.6/multiprocessing/connection.py", line 414, in _poll
r = wait([self], timeout)
File "/opt/conda/envs/pytorch-py3.6/lib/python3.6/multiprocessing/connection.py", line 911, in wait
ready = selector.select(timeout)
File "/opt/conda/envs/pytorch-py3.6/lib/python3.6/selectors.py", line 376, in select
fd_event_list = self._poll.poll(timeout)
KeyboardInterrupt
 swethmandava
on 25 Aug 2018
swethmandava
on 25 Aug 2018
I am using version '0.5.0a0+f57e4ce' and had the same problem. Either cancelling parallel data loader (num_workers=0) or setting cv2.setNumThreads(0) works.
 omersumer
on 5 Oct 2018
omersumer
on 5 Oct 2018
I am fairly confident that #11985 should eliminate all the hangs (unless you interrupt at unfortunate times which we can't control). Now that it is merged, I am closing this.
The hang with cv2 is also out of our control as cv2 just doesn't play nicely with multiprocessing.
SsnL
on 9 Oct 2018
Still experiencing this as of torch_nightly-1.0.0.dev20181029, hasn't the PR been merged there yet?
 Evpok
on 30 Oct 2018
Evpok
on 30 Oct 2018
@Evpok this has been merged there. You should have this patch for sure. Wondering if there's any more lingering deadlocks possible. Do you have an easy repro that we can try look at?
soumith
on 30 Oct 2018
I actually traced it to an unrelated multiprocessing mess on my side, sorry for the inconvenience.
Evpok
on 30 Oct 2018
hi @Evpok
i use torch_nightly-1.0.0, and meet this problem. have u solved this problem?
 zimenglan-sysu-512
on 14 Nov 2018
zimenglan-sysu-512
on 14 Nov 2018
If you are using collate_fn, and num_workers>0 with PyTorch version < 0.4:
MAKE SURE YOU DON'T RETURN ZERO DIM TENSORS FROM YOUR
__getitem__()FUNCTION.
OR RETURN THEM AS NUMPY ARRAYS.
I fixed my bug of returning zeros dim tensors and the problem still exists.
 liluxuan1997
on 14 Nov 2018
liluxuan1997
on 14 Nov 2018
@zimenglan-sysu-512 The main issue was with the limitations of multiprocessing : when using spawn or forkserver (which is needed for CPU-GPU communication) sharing objects between process is rather limited and not suitable for the kind of objects I have to manipulate.
Evpok
on 14 Nov 2018
None of this worked for me. However, the latest opencv works (3.4.0.12 to 3.4.3.18 nothing else to change):
sudo pip3 install --upgrade opencv-python
 see--
on 17 Nov 2018
see--
on 17 Nov 2018
@see-- glad to know that opencv fixed their thing :)
SsnL
on 17 Nov 2018
I'm on OpenCV 3.4.3.18 with python2.7, and I still see the deadlock happening. :/
 SreenivasVRao
on 3 Dec 2018
SreenivasVRao
on 3 Dec 2018
Please try the following:
from torch.utils.data.dataloader import DataLoader
instead of
from torch.utils.data import DataLoader
I think there is an issue with the type checking here:
https://github.com/pytorch/pytorch/blob/656b565a0f53d9f24547b060bd27aa67ebb89b88/torch/utils/data/dataloader.py#L816
 jewfro-cuban
on 16 Dec 2018
jewfro-cuban
on 16 Dec 2018
Please try the following:
from torch.utils.data.dataloader import DataLoaderinstead of
from torch.utils.data import DataLoaderI think there is an issue with the type checking here:
pytorch/torch/utils/data/dataloader.py
Line 816 in 656b565
super(DataLoader, self).__setattr__(attr, val)
Is this not just an alias? in torch.utils.data.__init__ they import dataloader.DataLoader
 simonhessner
on 8 Jan 2019
simonhessner
on 8 Jan 2019
I also had hanging with num_workers > 0. My code has no opencv, and the memory usage of /dev/shm is not an issue. No suggestions above worked for me. My fix was to update numpy from 1.14.1 to 1.14.5:
conda install numpy=1.14.5
Hope it is helpful.
 daniyar-niantic
on 8 Jan 2019
daniyar-niantic
on 8 Jan 2019
Hmm, my numpy version is 1.15.4, so newer than 1.14.5... Should be okay then?
simonhessner
on 8 Jan 2019
Hmm, my numpy version is 1.15.4, so newer than 1.14.5... Should be okay then?
Idk, my update of numpy also updated mkl.
daniyar-niantic
on 8 Jan 2019
Which mkl version do you have? Mine is 2019.1 (build 144) and other packages that include mkl in their name are:
mkl-service 1.1.2 py37he904b0f_5
mkl_fft 1.0.6 py37hd81dba3_0
mkl_random 1.0.2 py37hd81dba3_0
simonhessner
on 8 Jan 2019
Which mkl version do you have? Mine is 2019.1 (build 144) and other packages that include mkl in their name are:
mkl-service 1.1.2 py37he904b0f_5
mkl_fft 1.0.6 py37hd81dba3_0
mkl_random 1.0.2 py37hd81dba3_0
conda list | grep mkl
mkl                       2018.0.1             h19d6760_4
mkl-service               1.1.2            py36h17a0993_4
If you still see hang in the newest pytorch, it would be greatly helpful if you can provide a short script that reproduces the issue. Thanks!
SsnL
on 9 Jan 2019
I'm still seeing this deadlock, I will see if I can create a script that reproduces.
 dtmoodie
on 15 Jan 2019
dtmoodie
on 15 Jan 2019
pin_memory=True solved the issue for me.
pyaf
on 30 Jan 2019
Doesn't seem to work for me with pin_memory=True, still got stuck after 70 epochs. Only thing that has worked for me so far is setting num_workers=0, but it is noticeably slower.
 jclevesque
on 14 Feb 2019
jclevesque
on 14 Feb 2019
I'm also experiencing the deadlock (occurs pretty randomly). Tried pin_memory and updating Numpy. I'll try running it on a different machine.
 Avsecz
on 14 Feb 2019
Avsecz
on 14 Feb 2019
If you are using multiple threads with data loaders in it, try using multiprocessing instead of multithreading. This completely solved the issue for me (and by the way, it is also better for computationally intensive tasks in Python because of the GIL)
simonhessner
on 14 Feb 2019
same error in Pytorch1.0, Pillow5.0.0 numpy1.16.1 python3.6
 jianlong-yuan
on 15 Feb 2019
jianlong-yuan
on 15 Feb 2019
I also get the same error. I have set pin_memory=True and num_workers=0. Although one thing that I noticed that when I use a small portion of the dataset, this error doesn't occur. Only using the entire dataset causes this error.
Edit: Just a simple restart of the system fixed it for me.
 Venka97
on 6 Mar 2019
Venka97
on 6 Mar 2019
I had a similar problem. In some code this function would (almost always) hang on d_iter.next():
def get_next_batch(d_iter, loader):
    try:
        data, label = d_iter.next()
    except StopIteration:
        d_iter = iter(loader)
        data, label = d_iter.next()
    return data, label
The hack that worked for me was to add a small delay after calling this function
trn_X, trn_y = get_next_batch(train_data_iter, train_loader)
time.sleep(0.003)
val_X, val_y = get_next_batch(valid_data_iter, valid_loader)
I guess the delay helped avoid some deadlock?
 enoonIT
on 20 Mar 2019
enoonIT
on 20 Mar 2019
I am still meeting this problem. Using pytorch 1.0 and python 3.7. When I was using multiple data_loader, this bug will appear. If I use less than 3 data_loader or use single GPU, this bug will not appear. Tried:
- time.sleep(0.003)
- pin_memory=True/False
- num_workers=0/1
- from torch.utils.data.dataloader import DataLoader
- writing 8192 to /proc/sys/kernel/shmmni
None of them works. Don't know whether there is any solutions?
 xuw080
on 16 Apr 2019
xuw080
on 16 Apr 2019
my solutions add cv2.setNumThreads(0) at preprocess program
I have 2 dataloader ,which are for train and val
I only could run evaluater once.
 lightningsoon
on 10 May 2019
lightningsoon
on 10 May 2019
I've just encountered this bug with pytorch 1.1. Same got got stuck twice on the same place: end of 99th epoch. pin_memory was set to False.
 Randl
on 17 May 2019
Randl
on 17 May 2019
Same problem when using workers>0, pin memory didn't solve the problem.
 nicolasCruzW21
on 20 May 2019
nicolasCruzW21
on 20 May 2019
my solutions add cv2.setNumThreads(0) at preprocess program
I have 2 dataloader ,which are for train and val
I only could run evaluater once.
This solution works for me, thanks
 zxhr2793
on 3 Jun 2019
zxhr2793
on 3 Jun 2019
the data loader stops when I finish an epoch and will start a new epoch.
meet the same problem. In my case, the problem arise when I install opencv-python (I have installed opencv3 before). After move opencv-python, the training will not stop.
 hongzhenwang
on 20 Jun 2019
hongzhenwang
on 20 Jun 2019
it's a good idea as well
At 2019-06-20 10:51:02, "hongzhenwang" notifications@github.com wrote:
the data loader stops when I finish an epoch and will start a new epoch.
meet the same problem. In my case, the problem arise when I install opencv-python (I have installed opencv3 before). After move opencv-python, the training will not stop.
—
You are receiving this because you commented.
Reply to this email directly, view it on GitHub, or mute the thread.
lightningsoon
on 27 Jun 2019
I am still meeting this problem. Using pytorch 1.0 and python 3.7. When I was using multiple data_loader, this bug will appear. If I use less than 3 data_loader or use single GPU, this bug will not appear. Tried:
1. time.sleep(0.003)

2. pin_memory=True/False

3. num_workers=0/1

4. from torch.utils.data.dataloader import DataLoader

5. writing 8192 to /proc/sys/kernel/shmmni
   None of them works. Don't know whether there is any solutions?
Still trying to find a workaround. I do agree that I've only seem to have this problem when I'm running 2 parallel processes on different GPU's at the same time. One keeps going while the other one halts.
 ArturoDeza
on 3 Jul 2019
ArturoDeza
on 3 Jul 2019
When I set the num_workers=4, the program stuck for few seconds(or mintues) every 4 batches., which waste a lot of time. Any idea on how to solve it ?
 huangchaoxing
on 27 Jul 2019
huangchaoxing
on 27 Jul 2019
adding the flags: pin_memory=True and num_workers=0 in the data loader is the solution!
ArturoDeza
on 27 Jul 2019
adding the flags: pin_memory=True and num_workers=0 in the data loader is the solution!
@ArturoDeza
This might be a solution.However, setting num_workers=0 slow down the whole data fetching of the cpu and the GPU usage rate will be very low.
huangchaoxing
on 28 Jul 2019
For me, the reason was there weren't enough CPUs in my system or not enough num_workers specified in the Dataloader. It might also be a good idea to disable threading in the Dataloader workers in case the __get_item__ method in the dataloader uses a threaded library like numpy, librosa or opencv (please see below why this might be important). This can be achieved by running your training script with OMP_NUM_THREADS=1 MKL_NUM_THREADS=1 python train.py. As a clarification for the discussion below, please note that each Dataloader batch is handled by a single worker: each worker handles batch_size samples to complete a single batch, and then starts processing a new batch of data.
You need to set num_workers lower than the number of CPUs in the machine (or pod if you are using Kubernetes), but high enough that the data is always ready for the next iteration. If the GPU runs each iteration in t seconds, and each dataloader worker takes N*t seconds to load/process a single batch, then you should set num_workers to at least N, to avoid GPU stalls. Of course, you have to have at least N CPUs in the system.
Unfortunately, if Dataloader uses any library that uses K threads, then the number of processes spawned becomes num_workers*K = N*K. This could be significantly higher than the number of CPUs in the machine. This throttles the pod, and the Dataloader becomes very slow. This can cause the Dataloader not to return a batch every t seconds, causing GPU stalls.
One way to avoid K threads is to call the main script by OMP_NUM_THREADS=1 MKL_NUM_THREADS=1 python train.py. This restricts each Dataloader worker to use a single thread, and avoid overwhelming the machine. You still have to have enough num_workers to keep the GPU fed.
You should also optimize your code in __get_item__ so that each worker completes its batch in a small amount of time. Please make sure time to complete pre-processing a batch by the worker is not hindered by the time to read training data from disk (especially if you are reading from a network storage), or the network bandwidth (if you are reading from a network disk). If your dataset is small and you have enough RAM, consider moving the dataset to the RAM (or /tmpfs) and read from there for quick access. For Kubernetes, you can create a RAM disk (search for emptyDir in Kubernetes).
If you have optimized your __get_item__ code, and ensured that disk access/network access are not the culprits, but still see stalls, you will need to request more CPUs (for a Kubernetes pod) or move your GPU to a machine with more CPUs.
Another option is to reduce the batch_size so that each worker has less work to do, and will finish pre-processing quicker. The latter option is not desirable in some cases, because there will be idle GPU memory not being utilized.
You could also consider doing some of the pre-processing offline, and take the weight off of each worker. For example, if each worker is reading in a wav file and computing spectrograms for the audio file, you could consider pre-computing the spectrograms offline and just read the computed spectrogram from disk in the worker. This will reduce the amount of work each worker has to do.
 gkeskin07
on 3 Aug 2019
gkeskin07
on 3 Aug 2019
meet the same issue with horovod
 jinhou
on 12 Aug 2019
jinhou
on 12 Aug 2019
Meet a similar issue... Deadlock while just finishing an epoch and starting to load data for validation...
 jackroos
on 20 Aug 2019
jackroos
on 20 Aug 2019
@jinhou @jackroos Same thing, randomly stuck at beginning of validation with horovod. What I currently do as workaround is to set a timeout and skip the validation. Do you have a solution?
 lzljzys
on 28 Aug 2019
lzljzys
on 28 Aug 2019
@jinhou @jackroos Same thing, randomly stuck at beginning of validation with horovod. What I currently do as workaround is to set a timeout and skip the validation. Do you have a solution?
No. I just turn off distributed training in that case.
jackroos
on 29 Aug 2019
I met a similar issue: the data loader stops when I finish an epoch and will start a new epoch.
why so much zan?
 foocker
on 22 Oct 2019
foocker
on 22 Oct 2019
I am still meeting this problem. Using pytorch 1.0 and python 3.7. When I was using multiple data_loader, this bug will appear. If I use less than 3 data_loader or use single GPU, this bug will not appear. Tried:
- time.sleep(0.003)
- pin_memory=True/False
- num_workers=0/1
- from torch.utils.data.dataloader import DataLoader
- writing 8192 to /proc/sys/kernel/shmmni
None of them works. Don't know whether there is any solutions?
num_workers set to 0 worked for me. You should make sure it is at 0 everywhere you are using it.
Some other potential solutions:
- from multiprocessing import set_start_method
set_start_method('spawn') - cv2.setNumThreads(0)
It seems 3 or 7 are the way to go.
 the7threvival
on 18 Nov 2019
the7threvival
on 18 Nov 2019
I experience this issue with pytorch 1.3, ubuntu16, all the above suggestions did not work except workers=0 which slows down execution. This only happens when running from the terminal, within Jupyter notebook everything is fine, even with workers=32.
The issue does not seem solved, should it be reopened? I see also many other people reporting the same problem...
 skariel
on 2 Dec 2019
skariel
on 2 Dec 2019
I am still meeting this problem. Using pytorch 1.0 and python 3.7. When I was using multiple data_loader, this bug will appear. If I use less than 3 data_loader or use single GPU, this bug will not appear. Tried:
- time.sleep(0.003)
- pin_memory=True/False
- num_workers=0/1
- from torch.utils.data.dataloader import DataLoader
- writing 8192 to /proc/sys/kernel/shmmni
None of them works. Don't know whether there is any solutions?num_workers set to 0 worked for me. You should make sure it is at 0 everywhere you are using it.
Some other potential solutions:
- from multiprocessing import set_start_method
set_start_method('spawn')- cv2.setNumThreads(0)
It seems 3 or 7 are the way to go.
I modified train.py like this:
from __future__ import division

import cv2
cv2.setNumThreads(0)

import argparse

...
And it works for me.
 DHZS
on 10 Dec 2019
DHZS
on 10 Dec 2019
Hey guys if I can help,
I also had this problem similar to this, but it would happen every 100 or so epochs.
I noticed it only happened with CUDA enabled, also dmesg has this log entry whenever it would crash.
python[11240]: segfault at 10 ip 00007fabdd6c37d8 sp 00007ffddcd64fd0 error 4 in libcudart.so.10.1.243[7fabdd699000+77000]
It's gibberish to me, but it told me that CUDA and python multithreading were not playing nice.
My fix was to disable cuda in the datathreads, here is a snippet of my python entry file.
from multiprocessing import set_start_method
import os

if __name__ == "__main__":
  set_start_method('spawn')
else:
  os.environ["CUDA_VISIBLE_DEVICES"] = ""

import torch
import application
Hopefully that may help anyone who lands here like I needed at the time.
 roderickObrist
on 24 Mar 2020
roderickObrist
on 24 Mar 2020
@jinhou @jackroos Same thing, randomly stuck at beginning of validation with horovod. What I currently do as workaround is to set a timeout and skip the validation. Do you have a solution?
No. I just turn off distributed training in that case.
I meet a similar issue in distributed training without using OpenCV after updating to PyTorch 1.4.
Now I have to run the validation once before the training and validation loop.
 wizardk
on 9 Jun 2020
wizardk
on 9 Jun 2020
I've had a lot of trouble with this. It seems to persist across versions of pytorch, versions of python and also different physical machines (that will likely have been set up identically).
Every time it is the same error:
File "/home/<me>/miniconda2/envs/<my-module>/lib/python3.8/site-packages/bicep/loops.py", line 73, in __call__
    for data, target in self.dataloader:
File "/home/<me>/miniconda2/envs/<my-module>/lib/python3.8/site-packages/torch/utils/data/dataloader.py", line 345, in __next__
    data = self._next_data()
File "/home/<me>/miniconda2/envs/<my-module>/lib/python3.8/site-packages/torch/utils/data/dataloader.py", line 830, in _next_data
    self._shutdown_workers()
File "/home/<me>/miniconda2/envs/<my-module>/lib/python3.8/site-packages/torch/utils/data/dataloader.py", line 942, in _shutdown_workers
    w.join()
File "/home/<me>/miniconda2/envs/<my-module>/lib/python3.8/multiprocessing/process.py", line 149, in join
    res = self._popen.wait(timeout)
File "/home/<me>/miniconda2/envs/<my-module>/lib/python3.8/multiprocessing/popen_fork.py", line 47, in wait
    return self.poll(os.WNOHANG if timeout == 0.0 else 0)
File "/home/<me>/miniconda2/envs/<my-module>/lib/python3.8/multiprocessing/popen_fork.py", line 27, in poll
    pid, sts = os.waitpid(self.pid, flag)
There is clearly some issue in the way that processes are being handled on the machine I'm using. None of the above solutions seem to work, apart from setting num_workers=0.
I would really like to be able to get to the bottom of this, does anyone have any idea where to start or how to interrogate this?
 brynhayder
on 9 Jun 2020
brynhayder
on 9 Jun 2020
Me too here.
ERROR: Unexpected segmentation fault encountered in worker.
Traceback (most recent call last):
  File "/home/miniconda/lib/python3.6/site-packages/torch/utils/data/dataloader.py", line 480, in _try_get_batch
    data = self.data_queue.get(timeout=timeout)
  File "/home/miniconda/lib/python3.6/multiprocessing/queues.py", line 104, in get
    if not self._poll(timeout):
  File "/home/miniconda/lib/python3.6/multiprocessing/connection.py", line 257, in poll
    return self._poll(timeout)
  File "/home/miniconda/lib/python3.6/multiprocessing/connection.py", line 414, in _poll
    r = wait([self], timeout)
  File "/home/miniconda/lib/python3.6/multiprocessing/connection.py", line 911, in wait
    ready = selector.select(timeout)
  File "/home/miniconda/lib/python3.6/selectors.py", line 376, in select
    fd_event_list = self._poll.poll(timeout)
  File "/home/miniconda/lib/python3.6/site-packages/torch/utils/data/_utils/signal_handling.py", line 65, in handler
    _error_if_any_worker_fails()
RuntimeError: DataLoader worker (pid 95106) is killed by signal: Segmentation fault.
One interest thing is
when I just parse the data line by line, I do not have this issue:
        with open(current_file, mode='rb') as f:
            text = f.read().decode('utf-8')
            all_data.extend(text.split('\n'))
but if I add a JSON parse logic after read line by line , it will report this error
with open(current_file, mode='rb') as f:
            text = f.read().decode('utf-8')
            all_data.extend(text.split('\n'))

        json_data = []
        for line in all_data:
            try:
                json_data.append(json.loads(line))
            except:
                break
return json_data
I understand there will be some JSON memory overhead, but even I decrease the number of worker into 2, and data set is very small, it still have same problem. I kind of doubt it is shm related. any clue?
 zhangruiskyline
on 16 Jun 2020
zhangruiskyline
on 16 Jun 2020
Shall we reopen this issue?
 takatosp1
on 18 Jun 2020
takatosp1
on 18 Jun 2020
I think we should. BTW, I did some GDB debug and nothing found there. so I am not really sure whether it is shared memory issue ,
(gdb) run

Starting program: /home/miniconda/bin/python performance.py

[Thread debugging using libthread_db enabled]

Using host libthread_db library "/lib/x86_64-linux-gnu/libthread_db.so.1".

[New Thread 0x7fffa60a6700 (LWP 61963)]

[New Thread 0x7fffa58a5700 (LWP 61964)]

[New Thread 0x7fffa10a4700 (LWP 61965)]

[New Thread 0x7fff9e8a3700 (LWP 61966)]

[New Thread 0x7fff9c0a2700 (LWP 61967)]

[New Thread 0x7fff998a1700 (LWP 61968)]

[New Thread 0x7fff970a0700 (LWP 61969)]

[New Thread 0x7fff9489f700 (LWP 61970)]

[New Thread 0x7fff9409e700 (LWP 61971)]

[New Thread 0x7fff8f89d700 (LWP 61972)]

[New Thread 0x7fff8d09c700 (LWP 61973)]

[New Thread 0x7fff8a89b700 (LWP 61974)]

[New Thread 0x7fff8809a700 (LWP 61975)]

[New Thread 0x7fff85899700 (LWP 61976)]

[New Thread 0x7fff83098700 (LWP 61977)]

[New Thread 0x7fff80897700 (LWP 61978)]

[New Thread 0x7fff7e096700 (LWP 61979)]

[New Thread 0x7fff7d895700 (LWP 61980)]

[New Thread 0x7fff7b094700 (LWP 61981)]

[New Thread 0x7fff78893700 (LWP 61982)]

[New Thread 0x7fff74092700 (LWP 61983)]

[New Thread 0x7fff71891700 (LWP 61984)]

[New Thread 0x7fff6f090700 (LWP 61985)]

[Thread 0x7fff7e096700 (LWP 61979) exited]

[Thread 0x7fff6f090700 (LWP 61985) exited]

[Thread 0x7fff74092700 (LWP 61983) exited]

[Thread 0x7fff7b094700 (LWP 61981) exited]

[Thread 0x7fff80897700 (LWP 61978) exited]

[Thread 0x7fff83098700 (LWP 61977) exited]

[Thread 0x7fff85899700 (LWP 61976) exited]

[Thread 0x7fff8809a700 (LWP 61975) exited]

[Thread 0x7fff8a89b700 (LWP 61974) exited]

[Thread 0x7fff8d09c700 (LWP 61973) exited]

[Thread 0x7fff8f89d700 (LWP 61972) exited]

[Thread 0x7fff9409e700 (LWP 61971) exited]

[Thread 0x7fff9489f700 (LWP 61970) exited]

[Thread 0x7fff970a0700 (LWP 61969) exited]

[Thread 0x7fff998a1700 (LWP 61968) exited]

[Thread 0x7fff9c0a2700 (LWP 61967) exited]

[Thread 0x7fff9e8a3700 (LWP 61966) exited]

[Thread 0x7fffa10a4700 (LWP 61965) exited]

[Thread 0x7fffa58a5700 (LWP 61964) exited]

[Thread 0x7fffa60a6700 (LWP 61963) exited]

[Thread 0x7fff71891700 (LWP 61984) exited]

[Thread 0x7fff78893700 (LWP 61982) exited]

[Thread 0x7fff7d895700 (LWP 61980) exited]

total_files = 5040.  //customer comments

[New Thread 0x7fff6f090700 (LWP 62006)]

[New Thread 0x7fff71891700 (LWP 62007)]

[New Thread 0x7fff74092700 (LWP 62008)]

[New Thread 0x7fff78893700 (LWP 62009)]

ERROR: Unexpected segmentation fault encountered in worker.

ERROR: Unexpected segmentation fault encountered in worker.

Traceback (most recent call last):

File "/home/zhrui/.local/lib/python3.6/site-packages/torch/utils/data/dataloader.py", line 761, in _try_get_data

data = self._data_queue.get(timeout=timeout)

File "/home/miniconda/lib/python3.6/multiprocessing/queues.py", line 104, in get

if not self._poll(timeout):

File "/home/miniconda/lib/python3.6/multiprocessing/connection.py", line 257, in poll

return self._poll(timeout)

File "/home/miniconda/lib/python3.6/multiprocessing/connection.py", line 414, in _poll

r = wait([self], timeout)

File "/home/miniconda/lib/python3.6/multiprocessing/connection.py", line 911, in wait

ready = selector.select(timeout)

File "/home/miniconda/lib/python3.6/selectors.py", line 376, in select

fd_event_list = self._poll.poll(timeout)

File "/home/zhrui/.local/lib/python3.6/site-packages/torch/utils/data/_utils/signal_handling.py", line 66, in handler

_error_if_any_worker_fails()

RuntimeError: DataLoader worker (pid 62005) is killed by signal: Segmentation fault.

During handling of the above exception, another exception occurred:

Traceback (most recent call last):

File "performance.py", line 62, in <module>

main()

File "performance.py", line 48, in main

for i,batch in enumerate(rl_data_loader):

File "/home/zhrui/.local/lib/python3.6/site-packages/torch/utils/data/dataloader.py", line 345, in __next__

data = self._next_data()

File "/home/zhrui/.local/lib/python3.6/site-packages/torch/utils/data/dataloader.py", line 841, in _next_data

idx, data = self._get_data()

File "/home/zhrui/.local/lib/python3.6/site-packages/torch/utils/data/dataloader.py", line 808, in _get_data

success, data = self._try_get_data()

File "/home/zhrui/.local/lib/python3.6/site-packages/torch/utils/data/dataloader.py", line 774, in _try_get_data

raise RuntimeError('DataLoader worker (pid(s) {}) exited unexpectedly'.format(pids_str))

RuntimeError: DataLoader worker (pid(s) 62005) exited unexpectedly

[Thread 0x7fff78893700 (LWP 62009) exited]

[Thread 0x7fff74092700 (LWP 62008) exited]

[Thread 0x7fff71891700 (LWP 62007) exited]

[Thread 0x7fff6f090700 (LWP 62006) exited]

[Inferior 1 (process 61952) exited with code 01]

(gdb) backtrace

No stack.
And I do think I have enough shared memory, at least I expect the shared memory good enough for quite a long time until segfault, but segment fault happens almost immediately after I launch the dataloader job
------ Messages Limits --------

max queues system wide = 32000

max size of message (bytes) = 8192

default max size of queue (bytes) = 16384

------ Shared Memory Limits --------

max number of segments = 4096

max seg size (kbytes) = 18014398509465599

max total shared memory (kbytes) = 18014398509481980

min seg size (bytes) = 1

------ Semaphore Limits --------

max number of arrays = 32000

max semaphores per array = 32000

max semaphores system wide = 1024000000

max ops per semop call = 500

semaphore max value = 32767
Hi @soumith @apaszke , can we re open this issue, I tried all solution proposed like increasing shm size and segment, nothing works, I am not using opencv or so, just simple JSON parsing. but issue still there. and I don't think it is shm related since checked I open all memory as shared memory. Stack trace also shows nothing there as posted above.
@apaszke , regarding your suggestion to
"Yes, a lot of those issues are because of third party libraries not being fork safe. One alternative resolution might be to use the spawn start method."
I am using dataloader multi worker, how can I change the method? I am setting set_start_method('spawn') into my main.py but dose not seem help
Also I have a general question here, if I enable multi worker(multi process) data loader, and in the main training I also start multi process as suggested in https://pytorch.org/docs/stable/notes/multiprocessing.html#multiprocessing-best-practices
how pytorch manage both dataloader and main training multi-process? will they share all possible process/threading on multi core GPU? also shared memory for multi process is "shared" by data loader and main training process? also if I have some data cook job like JSON parsing, CSV parsing, pandas feature extraction. etc, where is best way to put? in dataloader to generate perfect to be ready data or just use main training to do so as some suggested above to keep data loader __get_item__ as simple as possible
zhangruiskyline
on 19 Jun 2020
@zhangruiskyline Your issue is not a deadlock really. It is about the workers being killed by segfault. sigbus is the one that suggests shm issues. You should check your dataset code and debug there.
To answer your other questions,
- use kwarg
multiproessing_context='spawn'in DataLoader will set spawn.set_start_methodalso does that. - usually in multiprocess training, each process has its own DataLoader, and thus DataLoader workers. Nothing is shared among processes unless explicitly done so.
SsnL
on 20 Jun 2020
Thanks @SsnL , I added multiproessing_context='spawn' but same failure.
I pointed out in previous thread, my code is very simple,
- this piece of code works
        with open(current_file, mode='rb') as f:
            text = f.read().decode('utf-8')
            all_data.extend(text.split('\n'))
- but if I add a JSON parse logic after read line by line , it will report this error
with open(current_file, mode='rb') as f:
            text = f.read().decode('utf-8')
            all_data.extend(text.split('\n'))

        json_data = []
        for line in all_data:
            try:
                json_data.append(json.loads(line))
            except:
                break
return json_data
so I doubt it is my code issue, also I try not using JSON parsing, but directly string split, same issue. it seems as long as I have some time consuming logic for data process in data loader this problem happen
Also regarding
multiprocess training, each process has its own DataLoader, and thus DataLoader workers Nothing is shared among processes unless explicitly done so.
So let's see I have 4 process for training, each one with a 8 worker data loader, so total 32 process underneath?
zhangruiskyline
on 20 Jun 2020
@zhangruiskyline Without a self-contained script to reproduce the issue, we can't help you. Yes there will be 32 processes
SsnL
on 20 Jun 2020
Thanks, I also saw similar issue in
https://github.com/pytorch/pytorch/issues/4969
https://github.com/pytorch/pytorch/issues/5040
both closed but I don't see clear solution or fix, is this still a wide existing problem?
I will see whether I can provide self contained reproduce script but it is highly integrated to our platform and data source, so will try
zhangruiskyline
on 20 Jun 2020
@zhangruiskyline Your issue isn't similar to any of the linked issues, if you read them. they are closed because the original / most common issue reported on those threads are already addressed.
SsnL
on 20 Jun 2020
Thanks @SsnL , I am not so familiar with Pytorch so I could be wrong, but I did go through all those , and looks like some of them seems resolved by
reduce number of worker to 0, this is unacceptable for us since it is too slow,
increase shm size, but we have enough shm I believe, and the issue happened almost immediately after we start, and I tried with much smaller data set problem is same
some lib like opencv dose not work in multi-process well, we are just using JSON/CSV, so not really fancy stuff
our code is fairly simple, training data set has 10000+ files, each file is multiple lines of JSON strings. in dataloader, we define __get_item__to get each file out of 10K+ files and read all content in that file.
in solution 1, we first read and split lines by line into JSON string list, if we immediately return, it works, performance is good
        with open(current_file, mode='rb') as f:
            text = f.read().decode('utf-8')
            all_data.extend(text.split('\n'))
            return all_data
now since returned value is still JSON string, we want to leverage multi process data loader to speed up, so put JSON parsing logic here and it fails
with open(current_file, mode='rb') as f:
            text = f.read().decode('utf-8')
            all_data.extend(text.split('\n'))

        json_data = []
        for line in all_data:
            try:
                json_data.append(json.loads(line))
            except:
                break
return json_data
we later thought JSON parsing is too heavy and also JSON has too much memory footprint, then we choose to parse JSON string and manually convert to feature list, same failure. did some stack trace analysis and nothing there
BTW, we are running our code in Linux Docker Env, 24 cores CPU and 1 V100.
I am not sure where should I start to investigate next. do you have any idea?
zhangruiskyline
on 20 Jun 2020
Hi,
I found an interesting comment in https://github.com/open-mmlab/mmcv, which is used in https://github.com/open-mmlab/mmdetection:
The following code is used in the beginning of both train epoch and val epoch.
time.sleep(2) # Prevent possible deadlock during epoch transition
May be you can try it.
mathmanu
on 20 Jun 2020
BTW, if I go to multi process and each process with multi worker data loader, how different process can ensure their corresponding dataloader won't read same data as other process's dataloader? is ti handled already by pytorch dataloader __get_item__ ?
zhangruiskyline
on 20 Jun 2020
Hi @SsnL , Thanks for your help. just want to follow up on this thread a bit, I refactor the training code using pytorch multi processing to speed up some data processing in CPU side(in order to feed to GPU faster ), https://pytorch.org/docs/stable/notes/multiprocessing.html#multiprocessing-best-practices
In each processing func, I also use multi-worker data loader to speed up the data loading processing time.https://pytorch.org/docs/stable/data.html
I put my heaving CPU JSON parsing not in dataloader, but in main training process, and the problem seems gone, I don't know why but anyway it seems working. but have a follow up question: suppose I have N processing, each has M dataloader worker, so total NxM underneath threading there.
If in my dataloader, I want to get all data in a index way, which means __get_item__(self, idx) in M data loader in N different processing can work together to process different index, how can I ensure they do not process duplicate or miss process some?
zhangruiskyline
on 23 Jun 2020
I had the same issue where the dataloader crashes after complaining that it could not allocate memory at the beginning of a new training or validation epoch. The solutions above did not work for me (i) my
/dev/shmis 32GB and it was never used more than 2.5GB, and (ii) setting pin_memory=False did not work.This is perhaps something to do with garbage collection? My code looks roughly like the following. I need an infinite iterator and hence I do a try / except around the
next()below :-)def train(): train_iter = train_loader.__iter__() for i in xrange(max_batches): try: x, y = next(train_iter) except StopIteration: train_iter = train_loader.__iter__() ... del train_iter
train_loaderis aDataLoaderobject. Without the explicitdel train_iterline at the end of the function, the process always crashes after 2-3 epochs (/dev/shmstill shows 2.5 GB). Hope this helps!I am using
4workers (version0.1.12_2with CUDA 8.0 on Ubuntu 16.04).
This solved the problem for me after weeks of struggling. I have to explicitly use the loader iterator instead of looping the loader directly and using the del loader_iterator at the end of the epoch finally removed the deadlocks
 kennyFF92
on 15 Jul 2020
kennyFF92
on 15 Jul 2020
I think I'm encountering the same issue. Trying to use 8 data loaders (MNIST, MNISTM, SVHN, USPS, for train and test each). Using 6 (any 6) works fine. Using 8 always blocks when loading the 6th one, MNIST-M test. It is stuck in some endless loop of trying to retrieve the image, failing, waiting a bit and then trying again. The error persists for any batch_size, I have plenty of free memory left, and it only goes away if I set num_workers to 0. Any other amount causes the issue
 pmirallesr
on 21 Jul 2020
pmirallesr
on 21 Jul 2020
I got some hint from https://stackoverflow.com/questions/54013846/pytorch-dataloader-stucked-if-using-opencv-resize-method
When I put cv2.setNumThreads(0), it works fine with me.
 LifeBeyondExpectations
on 17 Aug 2020
LifeBeyondExpectations
on 17 Aug 2020
Hello, I had the same issue. And it had to do with ulimit -n, simply increase it and the problem is solved, I used ulimit -n 500000
 SebastienEske
on 18 Aug 2020
SebastienEske
on 18 Aug 2020
@SebastienEske ulimit -n fixed this for me as well, on Ubuntu 20.04
 david-waterworth
on 24 Sep 2020
david-waterworth
on 24 Sep 2020
Maybe set ulimit -n is a right way, With the increase of the model, the deadlock becomes more and more frequent, I also test cv2.setNumThreads(0) , But it doesn't work.
 BLING-1994
on 27 Sep 2020
BLING-1994
on 27 Sep 2020
For the record, cv2.setNumThreads(0) worked for me.
 franchesoni
on 18 Nov 2020
franchesoni
on 18 Nov 2020
Related issues
 NgPDat
·
3Comments
NgPDat
·
3Comments
 bartolsthoorn
·
3Comments
bartolsthoorn
·
3Comments
 Coderx7
·
3Comments
Coderx7
·
3Comments
 negrinho
·
3Comments
negrinho
·
3Comments
 bartvm
·
3Comments
bartvm
·
3Comments
Most helpful comment
I met a similar issue: the data loader stops when I finish an epoch and will start a new epoch.