Kubernetes: [test flakes] master-scalability suites
Failing release-blocking suites:
- [x] https://k8s-testgrid.appspot.com/sig-release-master-blocking#gce-scale-correctness
- [x] https://k8s-testgrid.appspot.com/sig-release-master-blocking#gci-gce-100
- [x] https://k8s-testgrid.appspot.com/sig-release-master-blocking#gce-scale-performance
all three suites are flaking a lot recently, mind triage?
/sig scalability
/priority failing-test
/kind bug
/status approved-for-milestone
cc @jdumars @jberkus
/assign @shyamjvs @wojtek-t
 krzyzacy
All 164 comments
- The correctness job is failing mostly due to timeout (need to adjust our schedule correspondingly) as there have been a bunch of e2es which got added to the suite recently (e.g https://github.com/kubernetes/kubernetes/pull/59391)
- For the 100-node flakes, we have https://github.com/kubernetes/kubernetes/issues/60500 (and I believe that's related.. need to check).
- For the performance job, I believe there's a regression (seems from the last few runs like it's around pod-startup latency). Maybe sth more too.
I'll try getting to them sometime during this week (having scarcity of free cycles atm).
 shyamjvs
on 28 Feb 2018
shyamjvs
on 28 Feb 2018
@shyamjvs is there any update for this issue?
krzyzacy
on 2 Mar 2018
https://k8s-testgrid.appspot.com/sig-release-master-blocking#gce-scale-correctness
I took a brief look into that. And either some test(s) are extreeeeemely slow or something is hanging somehwere. Par of logs from last run:
62571 I0301 23:01:31.360] Mar  1 23:01:31.348: INFO: Running AfterSuite actions on all node
62572 I0301 23:01:31.360]
62573 W0302 07:32:00.441] 2018/03/02 07:32:00 process.go:191: Abort after 9h30m0s timeout during ./hack/ginkgo-e2e.sh --ginkgo.flakeAttempts=2 --ginkgo.skip=\[Serial\]|\[Disruptive      \]|\[Flaky\]|\[Feature:.+\]|\[DisabledForLargeClusters\] --allowed-not-ready-nodes=50 --node-schedulable-timeout=90m --minStartupPods=8 --gather-resource-usage=master --gathe      r-metrics-at-teardown=master --logexporter-gcs-path=gs://kubernetes-jenkins/logs/ci-kubernetes-e2e-gce-scale-correctness/80/artifacts --report-dir=/workspace/_artifacts --dis      able-log-dump=true --cluster-ip-range=10.64.0.0/11. Will terminate in another 15m
62574 W0302 07:32:00.445] SIGABRT: abort
No test finished within 8h30m
 wojtek-t
on 2 Mar 2018
wojtek-t
on 2 Mar 2018
https://k8s-testgrid.appspot.com/sig-release-master-blocking#gce-scale-performance
Indeed seems like a regression. I think the regression happened somewhere between runs:
105 (which was still ok)
108 (which had visibly higher startup time)
We can try looking into kubemark-5000 to see if it is visible there too.
wojtek-t
on 2 Mar 2018
Kubemark-5000 is pretty stable. 99th percentile on this graph (maybe the regression happened even before, but I think it is somewhere between 105 and 108):

wojtek-t
on 2 Mar 2018
Regarding the corretness tests - gce-large-correctness is also failing.
Maybe some test that is extremely long was added at that time?
wojtek-t
on 2 Mar 2018
Thanks a lot for looking @wojtek-t. Wrt performance job - I too feel strongly there's a regression (though I couldn't get to look properly into them).
Maybe some test that is extremely long was added at that time?
I was looking into this a while ago. And there were 2 suspicious changes I found:
- #59391 - This added a bunch of tests around local storage (the runs after this change started to timeout)
- StatefulSet with pod anti-affinity should use volumes spread across nodes (this test seems to be running for 3.5 - 5hr) - https://k8s-gubernator.appspot.com/build/kubernetes-jenkins/logs/ci-kubernetes-e2e-gce-scale-correctness/79
shyamjvs
on 2 Mar 2018
cc @kubernetes/sig-storage-bugs
shyamjvs
on 2 Mar 2018
/assign
Some of the local storage tests will try to use every node in the cluster, thinking that cluster sizes are not that big. I'll add a fix to cap the max number of nodes.
 msau42
on 2 Mar 2018
msau42
on 2 Mar 2018
Some of the local storage tests will try to use every node in the cluster, thinking that cluster sizes are not that big. I'll add a fix to cap the max number of nodes.
Thanks @msau42 - that would be great.
wojtek-t
on 2 Mar 2018
Going back to https://k8s-testgrid.appspot.com/sig-release-master-blocking#gce-scale-performance suite
I took a closer look into runs up to 105 and runs 108 and after that.
The biggest difference wrt to pod startup time seem to appear at the step:
10% worst watch latencies:
[the name of it is misleading - will explain below]
Up to 105 run, it generally looked like this:
I0129 21:17:43.450] Jan 29 21:17:43.356: INFO: perc50: 1.041233793s, perc90: 1.685463015s, perc99: 2.350747103s
Starting with 108 run, it looks more like:
Feb 12 10:08:57.123: INFO: perc50: 1.122693874s, perc90: 1.934670461s, perc99: 3.195883331s
That basically means ~0.85s increase and this roughly what we observe in the end result.
Now - what that "watch lag" is.
It is basically a time between "Kubelet observed that the pod is running" to "when test observed pod update setting its state to running".
There are a couple possibility where we could have regressed:
- kubelet is slowed in reporting status
- kubelet is qps-starved (and thus slower in reporting status)
- apiserver is slower (e.g. cpu-starved) and thus processing requests slower (either write, watch, or both)
- test is cpu-starved and thus processing incoming events slower
Since we don't really observe a difference between "schedule -> start" of a pod, that suggests that it most probably isn't apiserver (because processing requests and watch is on that path too), and it's most probably not slow kubelet too (because it starts the pod).
So i think the most likely hypothesis is:
- kubelet is qps-starved (or sth that prevents it from quickly sending status update)
- test is cpu-starved (or sth like that)
Test didn't change at all around that time. So I think it's most probably the first one.
That said, I went through PRs merged between 105 and 108 runs and didn't find anything useful so far.
wojtek-t
on 2 Mar 2018
I think the next step is to:
- look into the slowest pods (there seem to be O(1s) difference between slowest too) and see whether the difference is "before"of "after" the update status request was sent
wojtek-t
on 2 Mar 2018
So I looked into example pods. And I'm already seeing this:
I0209 10:01:19.960823       1 wrap.go:42] PUT /api/v1/namespaces/e2e-tests-density-30-16-5pl6z/pods/density-latency-pod-3115-fh7hl/status: (1.615907ms) 200 [[kubelet/v1.10.0 (l    inux/amd64) kubernetes/05944b1] 35.196.200.5:37414]
...
I0209 10:01:22.464046       1 wrap.go:42] PUT /api/v1/namespaces/e2e-tests-density-30-16-5pl6z/pods/density-latency-pod-3115-fh7hl/status: (279.153µs) 429 [[kubelet/v1.10.0 (li    nux/amd64) kubernetes/05944b1] 35.196.200.5:37414]
I0209 10:01:23.468353       1 wrap.go:42] PUT /api/v1/namespaces/e2e-tests-density-30-16-5pl6z/pods/density-latency-pod-3115-fh7hl/status: (218.216µs) 429 [[kubelet/v1.10.0 (li    nux/amd64) kubernetes/05944b1] 35.196.200.5:37414]
I0209 10:01:24.470944       1 wrap.go:42] PUT /api/v1/namespaces/e2e-tests-density-30-16-5pl6z/pods/density-latency-pod-3115-fh7hl/status: (1.42987ms) 200 [[kubelet/v1.10.0 (li    nux/amd64) kubernetes/05944b1] 35.196.200.5:37414]
I0209 09:57:01.559125       1 wrap.go:42] PUT /api/v1/namespaces/e2e-tests-density-30-35-gjzmd/pods/density-latency-pod-2034-t7c7h/status: (1.836423ms) 200 [[kubelet/v1.10.0 (l    inux/amd64) kubernetes/05944b1] 35.229.43.12:37782]
...
I0209 09:57:04.452830       1 wrap.go:42] PUT /api/v1/namespaces/e2e-tests-density-30-35-gjzmd/pods/density-latency-pod-2034-t7c7h/status: (231.2µs) 429 [[kubelet/v1.10.0 (linu    x/amd64) kubernetes/05944b1] 35.229.43.12:37782]
I0209 09:57:05.454274       1 wrap.go:42] PUT /api/v1/namespaces/e2e-tests-density-30-35-gjzmd/pods/density-latency-pod-2034-t7c7h/status: (213.872µs) 429 [[kubelet/v1.10.0 (li    nux/amd64) kubernetes/05944b1] 35.229.43.12:37782]
I0209 09:57:06.458831       1 wrap.go:42] PUT /api/v1/namespaces/e2e-tests-density-30-35-gjzmd/pods/density-latency-pod-2034-t7c7h/status: (2.13295ms) 200 [[kubelet/v1.10.0 (li    nux/amd64) kubernetes/05944b1] 35.229.43.12:37782]
I0209 10:01:53.063575       1 wrap.go:42] PUT /api/v1/namespaces/e2e-tests-density-30-5-6w4kv/pods/density-latency-pod-3254-586j7/status: (1.410064ms) 200 [[kubelet/v1.10.0 (li    nux/amd64) kubernetes/05944b1] 35.196.212.60:3391
...
I0209 10:01:55.259949       1 wrap.go:42] PUT /api/v1/namespaces/e2e-tests-density-30-5-6w4kv/pods/density-latency-pod-3254-586j7/status: (10.4894ms) 429 [[kubelet/v1.10.0 (lin    ux/amd64) kubernetes/05944b1] 35.196.212.60:33916]
I0209 10:01:56.266377       1 wrap.go:42] PUT /api/v1/namespaces/e2e-tests-density-30-5-6w4kv/pods/density-latency-pod-3254-586j7/status: (233.931µs) 429 [[kubelet/v1.10.0 (lin    ux/amd64) kubernetes/05944b1] 35.196.212.60:33916]
I0209 10:01:57.269427       1 wrap.go:42] PUT /api/v1/namespaces/e2e-tests-density-30-5-6w4kv/pods/density-latency-pod-3254-586j7/status: (182.035µs) 429 [[kubelet/v1.10.0 (lin    ux/amd64) kubernetes/05944b1] 35.196.212.60:33916]
I0209 10:01:58.290456       1 wrap.go:42] PUT /api/v1/namespaces/e2e-tests-density-30-5-6w4kv/pods/density-latency-pod-3254-586j7/status: (13.44863ms) 200 [[kubelet/v1.10.0 (li    nux/amd64) kubernetes/05944b1] 35.196.212.60:33916]
So it seems pretty clear that the problem is related to "429"s.
wojtek-t
on 2 Mar 2018
Are those throttled API calls due to a quota on the owner account?
 jdumars
on 2 Mar 2018
jdumars
on 2 Mar 2018
Are those throttled API calls due to a quota on the owner account?
This isn't throttling as I thought initially. These are 429s on apiserver (the reason may be either slower apiserver because of some reason, or more requests coming to apiserver).
wojtek-t
on 2 Mar 2018
Oh, ok. That's not great news.
jdumars
on 2 Mar 2018
/milestone clear
krzyzacy
on 2 Mar 2018
/milestone v1.10
krzyzacy
on 2 Mar 2018
/milestone clear
 cjwagner
on 2 Mar 2018
cjwagner
on 2 Mar 2018
@cjwagner: You must be a member of the kubernetes-milestone-maintainers github team to set the milestone.
In response to this:
/milestone clear
Instructions for interacting with me using PR comments are available here. If you have questions or suggestions related to my behavior, please file an issue against the kubernetes/test-infra repository.
 k8s-ci-robot
on 2 Mar 2018
k8s-ci-robot
on 2 Mar 2018
/milestone v1.9
cjwagner
on 2 Mar 2018
@cjwagner: You must be a member of the kubernetes-milestone-maintainers github team to set the milestone.
In response to this:
/milestone v1.9
Instructions for interacting with me using PR comments are available here. If you have questions or suggestions related to my behavior, please file an issue against the kubernetes/test-infra repository.
k8s-ci-robot
on 2 Mar 2018
Seems like PR https://github.com/kubernetes/kubernetes/pull/60740 fixed the timeout issues - thanks @msau42 for quick response.
Our correctness jobs (both 2k and 5k) are back to green now:
- https://k8s-testgrid.appspot.com/sig-scalability-gce#gce-large-correctness
- https://k8s-testgrid.appspot.com/sig-scalability-gce#gce-scale-correctness
So my suspicion about those volume tests was indeed right :)
shyamjvs
on 5 Mar 2018
ACK. In progress
ETA: 9/3/2018
Risks: Potential impact on k8s performance
shyamjvs
on 5 Mar 2018
So I digged up a bit into this and from the graph of pod-startup latency for our 5k-node test, I have the feeling that the regression could also be in b/w runs 108 and 109 (see 99%ile):

shyamjvs
on 5 Mar 2018
I swept quickly through the diff and the following change seems suspicious to me:
"Allow passing request-timeout from NewRequest all the way down" #51042
That PR is enabling propagation of the client's timeout as a query parameter to the API call. And I indeed see following difference in PATCH node/status calls across those 2 runs (from the apiserver logs):
run-108:
I0207 22:01:06.450385       1 wrap.go:42] PATCH /api/v1/nodes/gce-scale-cluster-minion-group-1-2rn2/status: (11.81392ms) 200 [[kubelet/v1.10.0 (linux/amd64) kubernetes/11104d7] 35.227.96.23:47270]
I0207 22:01:03.857892       1 wrap.go:42] PATCH /api/v1/nodes/gce-scale-cluster-minion-group-3-9659/status: (8.570809ms) 200 [[kubelet/v1.10.0 (linux/amd64) kubernetes/11104d7] 35.196.85.108:43532]
I0207 22:01:03.857972       1 wrap.go:42] PATCH /api/v1/nodes/gce-scale-cluster-minion-group-3-wc4w/status: (8.287643ms) 200 [[kubelet/v1.10.0 (linux/amd64) kubernetes/11104d7] 35.229.110.22:50530]
run-109:
I0209 21:01:08.551289       1 wrap.go:42] PATCH /api/v1/nodes/gce-scale-cluster-minion-group-2-89f2/status?timeout=10s: (71.351634ms) 200 [[kubelet/v1.10.0 (linux/amd64) kubernetes/05944b1] 35.229.77.215:51070]
I0209 21:01:08.551310       1 wrap.go:42] PATCH /api/v1/nodes/gce-scale-cluster-minion-group-2-3ms3/status?timeout=10s: (70.705466ms) 200 [[kubelet/v1.10.0 (linux/amd64) kubernetes/05944b1] 35.227.84.87:49936]
I0209 21:01:08.551394       1 wrap.go:42] PATCH /api/v1/nodes/gce-scale-cluster-minion-group-3-wc02/status?timeout=10s: (70.847605ms) 200 [[kubelet/v1.10.0 (linux/amd64) kubernetes/05944b1] 35.196.125.143:53662]
My hypothesis is that, because of that added timeout of 10s to the PATCH calls, those calls are now lasting for longer time on the server-side (IIUC this comment correctly). This means that they're now in the inflight-queue for longer duration. That, combined with the fact that those PATCH calls occur in huge amounts in such big clusters, is leading to PUT pod/status calls unable to get enough bandwidth in inflight-queue and hence are returned with 429s. As a result, the kubelet-side delay in updating the pod-status has increased. This story also fits in well with @wojtek-t 's observations above.
I'll try to gather more evidence to verify this hypothesis.
shyamjvs
on 5 Mar 2018
So I checked how PATCH node-status latencies vary over the test runs, and it indeed seems like there's a rise in the 99th percentile (see the top line) around that time. However it isn't super clear that it happened b/w runs 108 and 109 (though my belief is that's the case):
shyamjvs
on 5 Mar 2018
[EDIT: My earlier comment wrongly mentioned the count for those 429s (client was npd, not kubelet)]
I have more supporting evidence now:
in run-108, we had ~479k PATCH node/status calls that got a 429:
{
        "metric": {
          "__name__": "apiserver_request_count",
          "client": "kubelet/v1.10.0 (linux/amd64) kubernetes/11104d7",
          "code": "429",
          "contentType": "resource",
          "resource": "nodes",
          "scope": "",
          "subresource": "status",
          "verb": "PATCH"
        },
        "value": [
          0,
          "479181"
        ]
      },
and in run-109, we have ~757k of those:
{
        "metric": {
          "__name__": "apiserver_request_count",
          "client": "kubelet/v1.10.0 (linux/amd64) kubernetes/05944b1",
          "code": "429",
          "contentType": "resource",
          "resource": "nodes",
          "scope": "",
          "subresource": "status",
          "verb": "PATCH"
        },
        "value": [
          0,
          "757318"
        ]
      },
And... Look at this:
in run-108:
{
        "metric": {
          "__name__": "apiserver_request_count",
          "client": "kubelet/v1.10.0 (linux/amd64) kubernetes/11104d7",
          "code": "429",
          "contentType": "namespace",
          "resource": "pods",
          "scope": "",
          "subresource": "status",
          "verb": "UPDATE"
        },
        "value": [
          0,
          "28594"
        ]
      },
and in run-109:
{
        "metric": {
          "__name__": "apiserver_request_count",
          "client": "kubelet/v1.10.0 (linux/amd64) kubernetes/05944b1",
          "code": "429",
          "contentType": "namespace",
          "resource": "pods",
          "scope": "",
          "subresource": "status",
          "verb": "UPDATE"
        },
        "value": [
          0,
          "33224"
        ]
      },
I checked the number for few other adjacent runs:
-- that PR merged --
While it seems a bit varying, overall it looks like the no. of 429s increased by about 25%.
shyamjvs
on 5 Mar 2018
And for PATCH node-status coming from kubelets that recieved 429s, here's how the numbers look like:
- run-104 = 313348
- run-105 = 309136
- run-108 = 479181
-- that PR merged --
- run-109 = 757318
- run-110 = 752062
- run-111 = 296368
This is also varying, but it generally seems to increase.
shyamjvs
on 5 Mar 2018
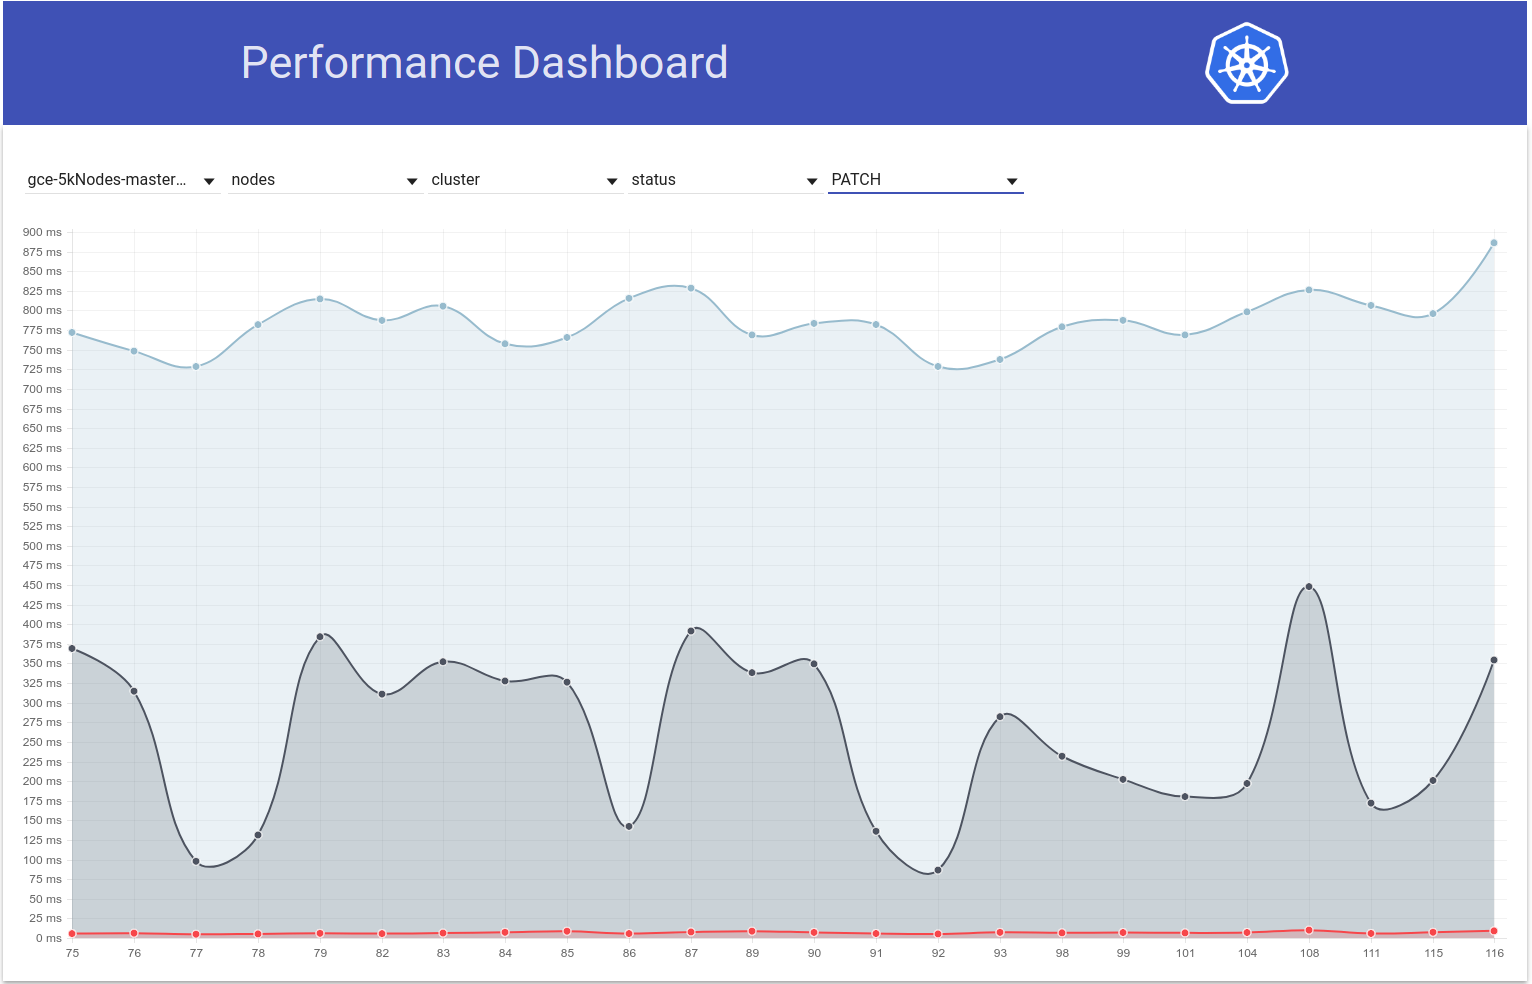
The 99th %ile of PATCH node-status call latencies also seem to have generally increased (as I was predicting in https://github.com/kubernetes/kubernetes/issues/60589#issuecomment-370573938):
run-104 (798ms), run-105 (783ms), run-108 (826ms)
run-109 (878ms), run-110 (869ms), run-111 (806ms)
Btw - Wrt all the above metrics, 108 seems to be a worse-than-normal run and 111 seems to be a better-than-normal run.
shyamjvs
on 5 Mar 2018
I'll try to verify this tomorrow by manually running a large 5k cluster.
shyamjvs
on 5 Mar 2018
thanks for triage @shyamjvs
krzyzacy
on 5 Mar 2018
So I ran density test twice against 5k cluster against ~HEAD, and the test surprisingly passed both times with 99%ile pod startup latency as 4.510015461s and 4.623276837s. However, the 'watch latencies', did show the increase that @wojtek-t pointed in https://github.com/kubernetes/kubernetes/issues/60589#issuecomment-369951288
In the first run it was:
INFO: perc50: 1.123056294s, perc90: 1.932503347s, perc99: 3.061238209s
and the second run it was:
INFO: perc50: 1.121218293s, perc90: 1.996638787s, perc99: 3.137325187s
I'll now try checking what was the case earlier.
shyamjvs
on 6 Mar 2018
https://github.com/kubernetes/kubernetes/issues/60589#issuecomment-370573938 - I'm not sure I'm following this Yes - we added timeout, but default timeout is bigger than 10s IIRC - so it should only help not make things worse.
I think we still don't understand why we observe more 429s (the fact that this is somehow related to 429s I already mentioned in https://github.com/kubernetes/kubernetes/issues/60589#issuecomment-370036377 )
wojtek-t
on 6 Mar 2018
And regarding your numbers - I'm not convinced that that the regression was in run 109 - there might have been two regressions - one in somewhere between 105 and 108 and the other in 109.
wojtek-t
on 6 Mar 2018
Hmm... I don't deny the possibilities you mentioned (the above was just my hypothesis).
I'm currently doing bisection (right now against 108's commit) to verify.
shyamjvs
on 6 Mar 2018
My feeling that the regression is before run 108 is stronger and stronger.
As an example, latencies of api calls are already increased in 108 run.
patch node status:
90%: 198ms (105) 447ms (108) 444ms (109)
put pod status:
99%: 83ms (105) 657ms (108) 728ms (109)
wojtek-t
on 6 Mar 2018
I guess what I'm trying to say is:
- the number of 429s is a consequence and we shouldn't spend too much time on that
- the root cause is either slower api calls or bigger number of those
We clearly seem to see slower api calls in 108. The question is whether we also see bigger number of those.
wojtek-t
on 6 Mar 2018
So I think why the requests are visibly slower - there are three main possibilities
there is significantly more requests (from a first glance it doesn't seem to be the case)
we added something on the path of processing (e.g. additional processing) or the objects themselves are bigger
something else on master machine (e.g. scheduler) is consuming more cpu and thus starving apiserver more
wojtek-t
on 6 Mar 2018
So me and @wojtek-t discussed offline and we both agree now that there's quite likely a regression before 108. Adding some points:
there is significantly more requests (from a first glance it doesn't seem to be the case)
Doesn't seem to be the case to me neither
we added something on the path of processing (e.g. additional processing) or the objects themselves are bigger
My feeling is it's sth more likely in kubelet as opposed to apiserver (as we're not seeing any visible change in patch/put latencies on kubemark-5000)
something else on master machine (e.g. scheduler) is consuming more cpu and thus starving apiserver more
IMO this is not the case as we're having quite some CPU/mem slack on our master. Also perf-dash doesn't suggest any considerable increase in usages of master components.
That said, I digged up a bit and "luckily" it seems like we're noticing this increase in watch latencies even for 2k-node clusters:
INFO: perc50: 1.024377533s, perc90: 1.589770858s, perc99: 1.934099611s
INFO: perc50: 1.03503718s, perc90: 1.624451701s, perc99: 2.348645755s
Should make bisecting a bit easier.
shyamjvs
on 6 Mar 2018
Unfortunately, the variation in those watch latencies seems like a one-off (it's otherwise roughly the same). Fortunately, we have PUT pod-status latency as a reliable indicator of the regression. I ran 2 rounds of bisection yesterday and narrowed down to this diff (~80 commits). I skimmed through them and have strong suspicion on:
- #58990 - adds a new field to pod-status (though I'm not sure if that'd be filled in our tests, where IIUC preemptions are not happening - but need to check)
- #58645 - updates etcd server version to 3.2.14
shyamjvs
on 7 Mar 2018
I really doubt that the #58990 is related here - NominatedNodeName is a string that contains a single node name. Even if it would be filled all the time, the change in object size should be negligible.
wojtek-t
on 7 Mar 2018
@wojtek-t - As you were suggesting offline, it indeed seems like we're using a different version (3.2.16) in kubemark (https://github.com/kubernetes/kubernetes/blob/master/test/kubemark/start-kubemark.sh#L62) which is the potential reason for not seeing this regression there :)
cc @jpbetz
shyamjvs
on 7 Mar 2018
We are using 3.2.16 everywhere now.
wojtek-t
on 7 Mar 2018
Oops.. Sorry for the hindsight - I was looking at a wrong combination of commits.
shyamjvs
on 7 Mar 2018
BTW - that increase in PUT pods/status latency is visible also in load test in large real clusters.
wojtek-t
on 7 Mar 2018
So I digged up a bit more and seems like we started observing greater latencies around that time for write requests in general (which makes me suspect etcd change even more):
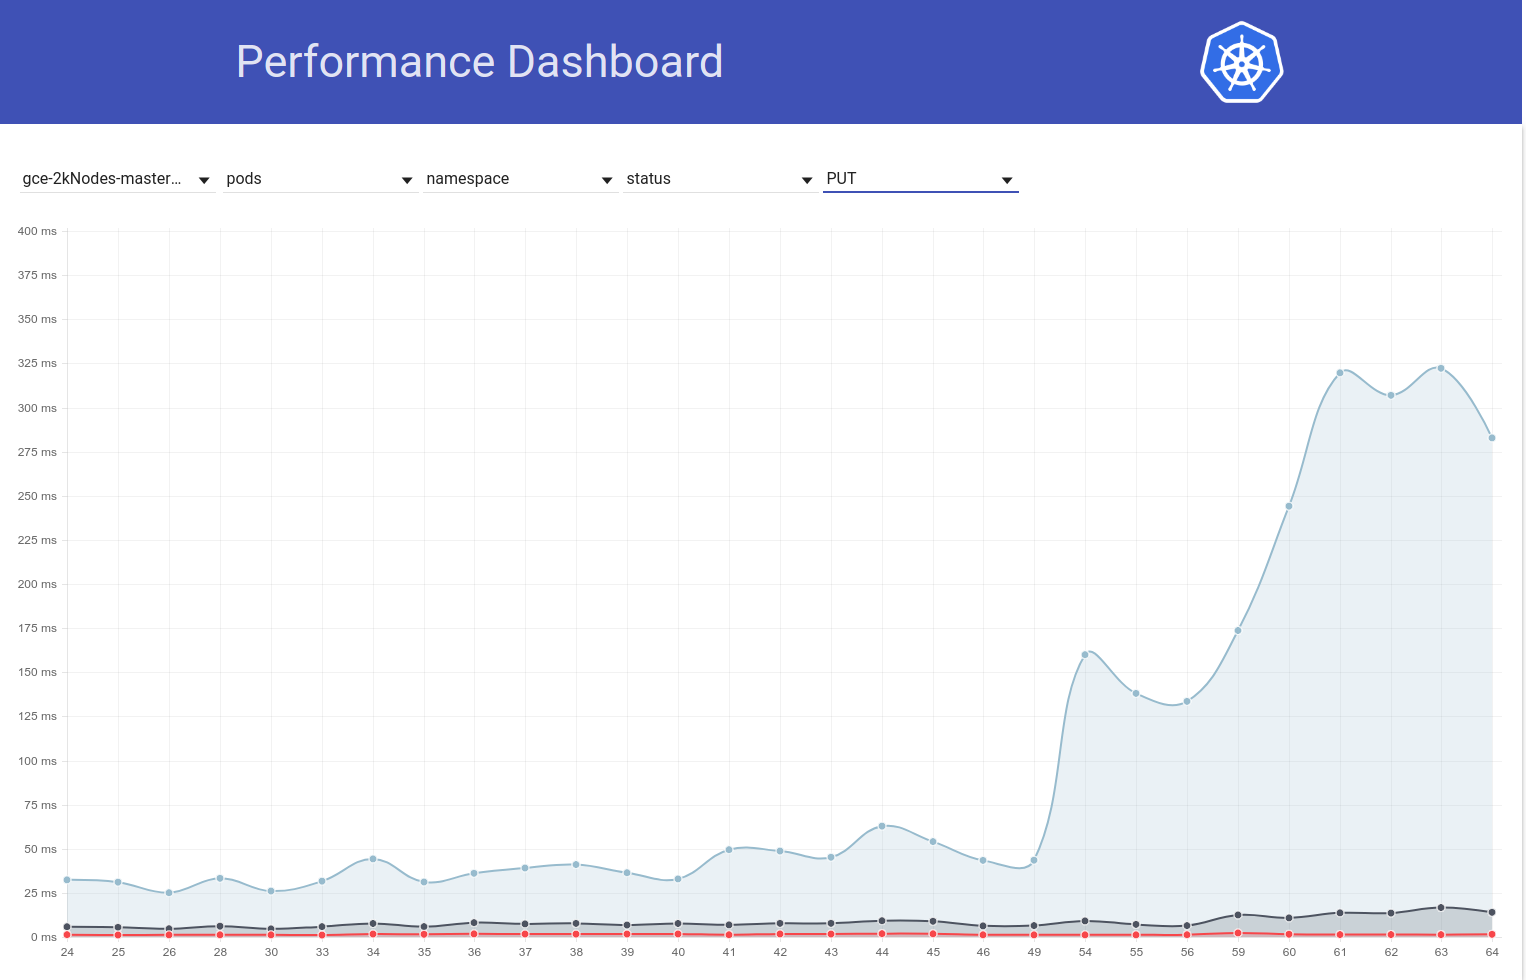

shyamjvs
on 7 Mar 2018
Actually, I vote that at least part of the problem is here:
https://github.com/kubernetes/kubernetes/pull/58990/commits/384a86caa92bdb7cf9ac96b10a6ef333d2d60519#diff-c73f80ad83608f18657d22a06950d929R240
I would be surprised if it would be the whole problem, but it may contribute to it.
Will send a PR changing that in a second.
wojtek-t
on 7 Mar 2018
FYI - When I ran against a commit that's before the etcd 3.2.14 change but after the pod-status API change, the put node-status latency seems totally fine (i.e 99%ile = 39ms).
shyamjvs
on 7 Mar 2018
So I verified that it indeed is caused by the etcd bump to 3.2.14. Here's how the put pod-status latency looks like:
against that PR:
{
      "data": {
        "Perc50": 1.479,
        "Perc90": 10.959,
        "Perc99": 163.095
      },
      "unit": "ms",
      "labels": {
        "Count": "344494",
        "Resource": "pods",
        "Scope": "namespace",
        "Subresource": "status",
        "Verb": "PUT"
      }
    },
against ~HEAD (from Mar 5) with that PR reverted (the test is still running, but about to finish soon):
apiserver_request_latencies_summary{resource="pods",scope="namespace",subresource="status",verb="PUT",quantile="0.5"} 1669
apiserver_request_latencies_summary{resource="pods",scope="namespace",subresource="status",verb="PUT",quantile="0.9"} 9597
apiserver_request_latencies_summary{resource="pods",scope="namespace",subresource="status",verb="PUT",quantile="0.99"} 63392
63ms seems quite similar to what it was before.
We should revert the version and try to understand:
- Why we're seeing this increase in etcd 3.2.14?
- Why we didn't catch this in kubemark?
cc @jpbetz @kubernetes/sig-api-machinery-bugs
shyamjvs
on 7 Mar 2018
One hypothesis (why we didn't catch that in kubemark - though it's still a guess) is that we may have changed sth wrt to certificates there.
When I'm comparing etcd log from kubemark and real cluster, only in the latter I'm seeing the following line:
2018-03-05 08:06:56.389648 I | embed: peerTLS: cert = /etc/srv/kubernetes/etcd-peer.crt, key = /etc/srv/kubernetes/etcd-peer.key, ca = , trusted-ca = /etc/srv/kubernetes/etcd-ca.crt, client-cert-auth = true
Looking into the PR itself I don't see any changes around that, but I also don't know why we should have see that line only in real clusters...
@jpbetz for thoughts
wojtek-t
on 7 Mar 2018
ACK. In progress
ETA: 9/3/2018
Risks: Issue root-caused (mostly)
shyamjvs
on 7 Mar 2018
Re peerTLS - it seems to be the case also before (with 3.1.11) so I think that's a red herring
wojtek-t
on 7 Mar 2018
cc @gyuho @wenjiaswe
 jpbetz
on 7 Mar 2018
jpbetz
on 7 Mar 2018
63ms seems quite similar to what
Where do we get those numbers? Is apiserver_request_latencies_summary actually measuring latencies of etcd writes? Also, metrics from etcd would help.
 gyuho
on 7 Mar 2018
gyuho
on 7 Mar 2018
embed: peerTLS: cert ...
This prints, if peer TLS is configured (same in 3.1).
gyuho
on 7 Mar 2018
Where do we get those numbers? Is apiserver_request_latencies_summary actually measuring latencies of etcd writes? Also, metrics from etcd would help.
This measures apicalls latency which (at least in case of write calls) includes latency of etcd.
We still don't really understand what is happening, but reverting to previous etcd version (3.1) fixes the regression. So clearly the problem is somewhere in etcd.
wojtek-t
on 7 Mar 2018
@shyamjvs
What Kubemark and Kubernetes versions are you running? We tested Kubemark 1.10 against etcd 3.2 vs 3.3 (500-node workloads), and didn't observe this. How many nodes are needed to reproduce this?
gyuho
on 7 Mar 2018
What Kubemark and Kubernetes versions are you running? We tested Kubemark 1.10 against etcd 3.2 vs 3.3 (500-node workloads), and didn't observe this. How many nodes are needed to reproduce this?
We can't reproduce it with kubemark, even with 5k-node one - see bottom of https://github.com/kubernetes/kubernetes/issues/60589#issuecomment-371171837
This appears to be a problem only in real clusters.
This is an open question why is it the case.
wojtek-t
on 7 Mar 2018
Since we've rolled back to etcd 3.1. for kubernetes. We also released etcd 3.1.12 with the only outstanding critical fix for kubernetes: mvcc "unsynced" watcher restore operation. Once we've found and fixed the root cause of the performance regression found in this issue we can sketch out a plan to upgrade the etcd server used by kubernetes back up to 3.2.
jpbetz
on 8 Mar 2018
looks like https://k8s-testgrid.appspot.com/sig-release-master-blocking#gci-gce-100 starts to fail consistently since this morning
krzyzacy
on 9 Mar 2018
From the diff, the only change is https://github.com/kubernetes/kubernetes/pull/60421 which is enabling quotas in our performance tests by default. The error we're seeing is:
Container kube-controller-manager-e2e-big-master/kube-controller-manager is using 0.531144723/0.5 CPU
not to have occurred
@gmarek - Seems like enabling quotas is affecting our scalability :) Could you look deeper into this - maybe sth serious?
Let me file another issue to keep this one on track.
shyamjvs
on 9 Mar 2018
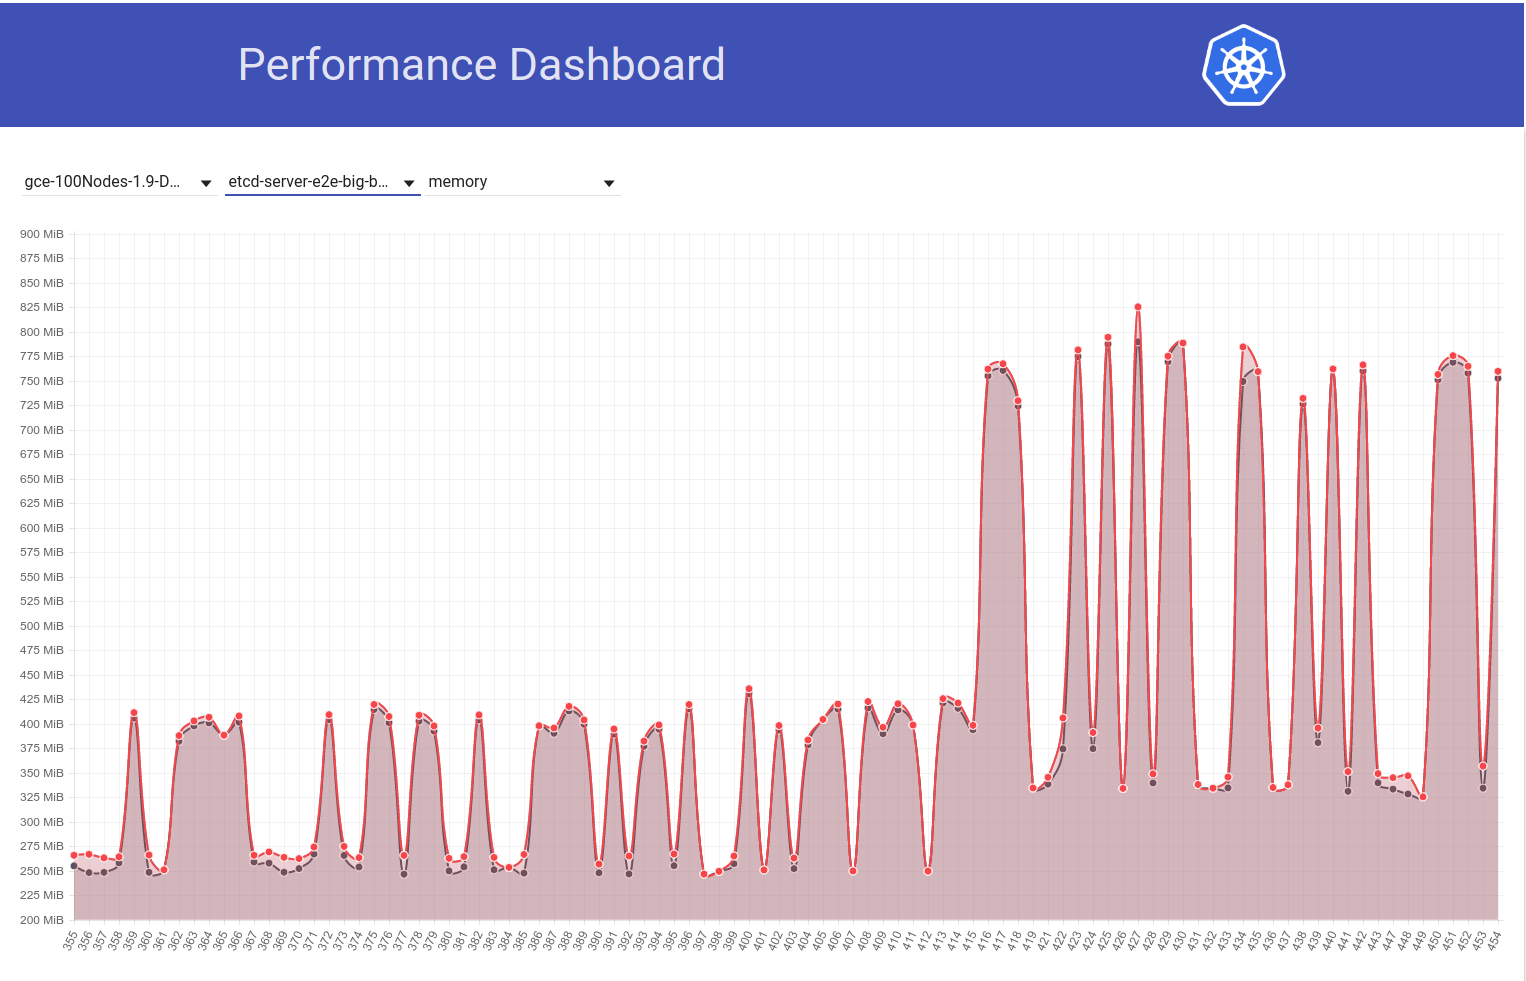
@wojtek-t @jpbetz @gyuho @timothysc I found something really interesting with the etcd version change, suggesting significant effect of moving from etcd 3.1.11 to 3.2.16.
Look at the following graph of etcd memory usage in our 100-node cluster (it has increased ~2x) when the job was moved from k8s release 1.9 to 1.10:
And next look at how our 100-node job (running against HEAD) sees a drop in mem-usage to half right after my revert from etcd 3.2.16 -> 3.1.11:
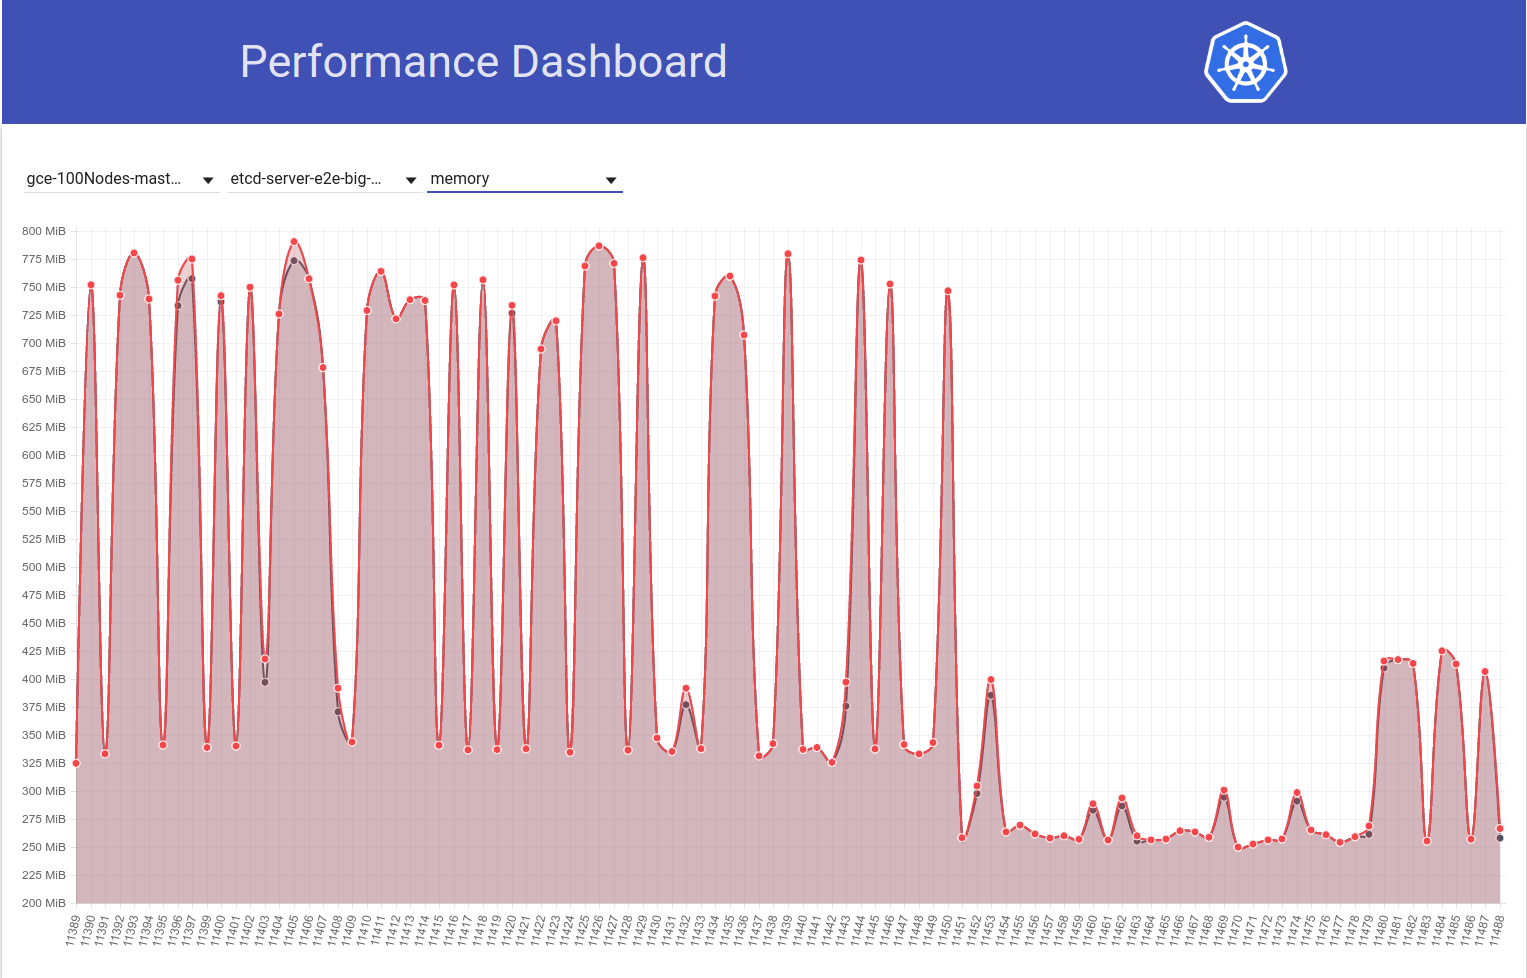
So etcd 3.2 server version CLEARLY is showing affected performance (with all other variables kept the same) :)
shyamjvs
on 10 Mar 2018
my revert from etcd 3.2.16 -> 3.2.11:
Did we mean 3.1.11?
gyuho
on 10 Mar 2018
That's right.. sorry. Edited my comment.
shyamjvs
on 10 Mar 2018
@shyamjvs How etcd is configured? We've increased default value --snapshot-count from 10000 to 100000, in v3.2. So if snapshot count is different, the one with larger snapshot count holds Raft entries for longer, thus requires more resident memory, before discarding old logs.
gyuho
on 10 Mar 2018
Aah! That indeed seems like a suspicious change. Wrt flags, I don't think there's any change in those from k8s side. Because, as you can see in my second graph above, the diff b/w runs 11450 and 11451 is mainly just my etcd revert change (which doesn't seem to touch any flags).
We've increased default value --snapshot-count from 10000 to 100000
Could you confirm if that's the root-cause of this increased mem usage? If so, we may want to:
- patch etcd back with original value, or
- set it to 10000 in k8s
before switching back to 3.2
shyamjvs
on 10 Mar 2018
Aah! That indeed seems like a suspicious change.
Yeah, this change should have been highlighted from etcd side (will improve our change logs and upgrade guides).
Could you confirm if that's the root-cause of this increased mem usage?
I am not sure if that would be the root cause. Lower snapshot-count will definitely help alleviate spiky memory usage. If both etcd versions use same snapshot count, but one etcd still shows much higher memory usage, there should be something else.
gyuho
on 10 Mar 2018
Update: I verified that the increase in etcd mem usage is indeed caused due to higher --snapshot-count default value. More details here - https://github.com/kubernetes/kubernetes/pull/61037#issuecomment-372457843
We should consider setting it to 10,000 when we're bumping to etcd 3.2.16, if we don't want the increased mem usage.
cc @gyuho @xiang90 @jpbetz
shyamjvs
on 12 Mar 2018
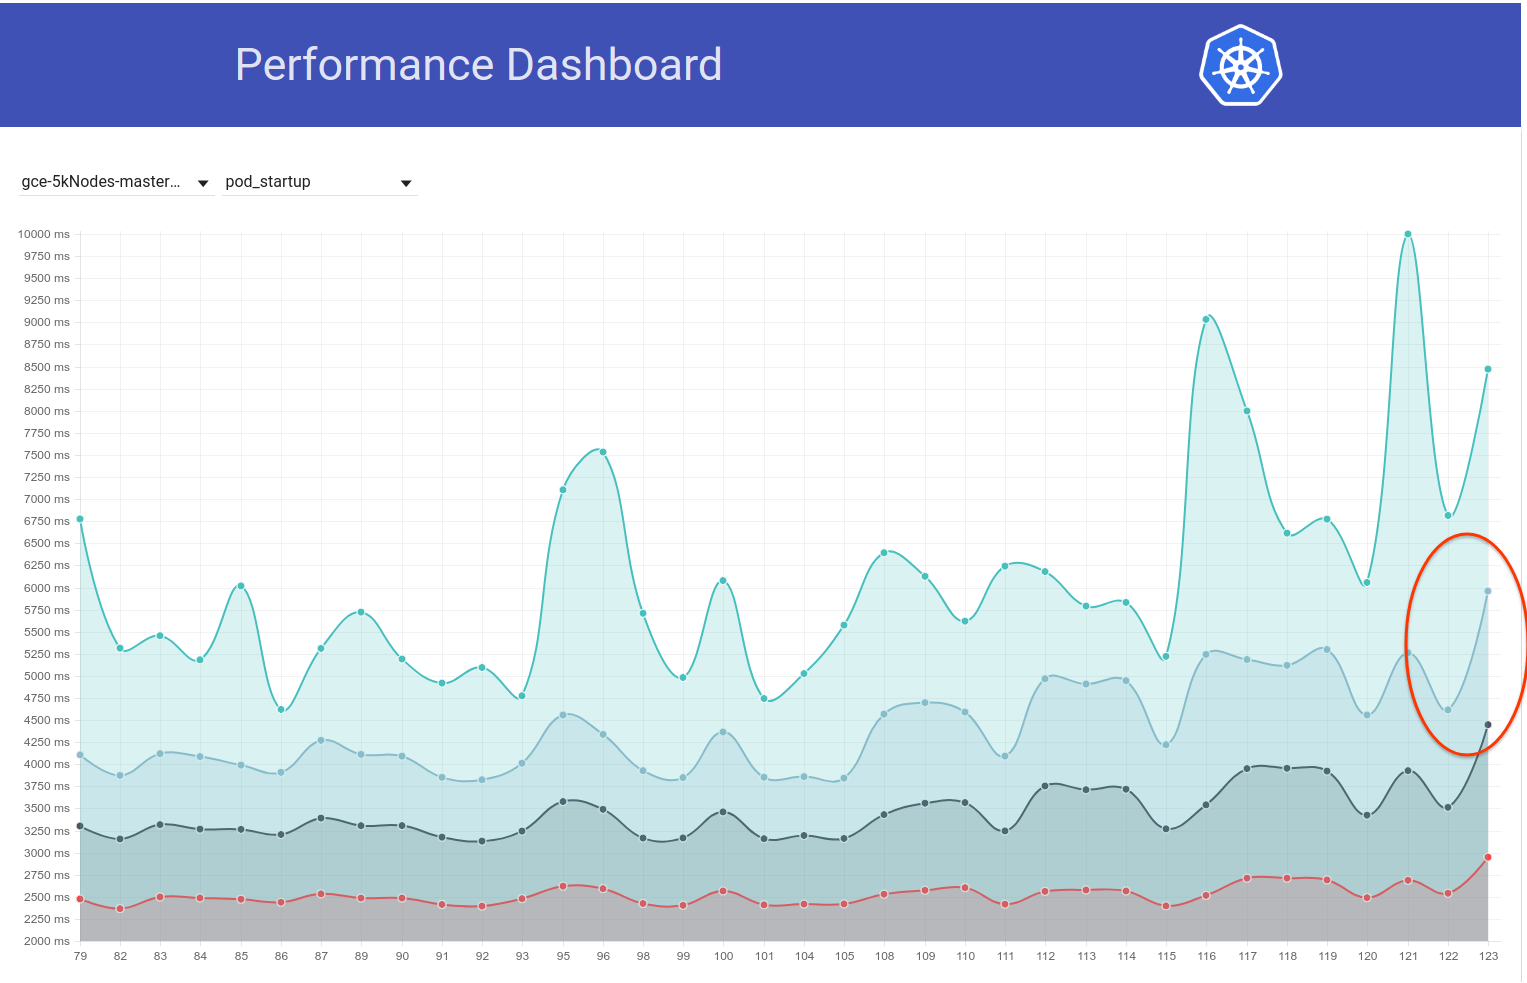
Update: With the etcd fix in, the pod startup latency 99% still seems to be close to violating the 5s SLO. There is at least one other regression and I've gathered evidence that it's most likely in b/w runs 111 and 112 of our 5k-node performance job (see the bump b/w those runs in the graph I pasted in https://github.com/kubernetes/kubernetes/issues/60589#issuecomment-370568929). Currently I'm bisecting the diff (which has about 50 commits) and the test takes ~4-5 hrs per iteration.
The evidence I was referring to above is the following:
Watch latencies at 111 were:
Feb 14 21:36:05.531: INFO: perc50: 1.070980786s, perc90: 1.743347483s, perc99: 2.629721166s
And overall pod-startup latencies at 111 were:
Feb 14 21:36:05.671: INFO: perc50: 2.416307575s, perc90: 3.24553118s, perc99: 4.092430858s
While the same at 112 were:
Feb 16 10:07:43.222: INFO: perc50: 1.131108849s, perc90: 2.18487651s, perc99: 3.570548412s
and
Feb 16 10:07:43.353: INFO: perc50: 2.56160248s, perc90: 3.754024568s, perc99: 4.967573867s
Meanwhile, if someone's up for the betting game - you can take a look at the commit diff I mentioned above and guess the faulty one :)
shyamjvs
on 12 Mar 2018
ACK. In progress
ETA: 13/03/2018
Risks: Can push release date if not debugged before that
shyamjvs
on 12 Mar 2018
@shyamjvs toooooooo many commits to place bets :)
 dims
on 13 Mar 2018
dims
on 13 Mar 2018
@dims That would add more fun I guess ;)
Update: So I ran few iterations of the bisection and here's how the relevant metrics looked across commits (ordered chronologically). Note that for the ones I ran manually, I ran them with the earlier regression reverted (i.e 3.2. -> 3.1.11).
| Commit | 99% watch latency | 99% pod-startup latency | Good/bad? |
| ------------- |-------------|-----|-------|
| a042ecde36 (from run-111) | 2.629721166s | 4.092430858s | Good (confirming again manually) |
| 5f7b530d87 (manual) | 3.150616856s | 4.683392706s | Bad (likely) |
| a8060ab0a1 (manual) | 3.11319985s | 4.710277511s | Bad (likely) |
| 430c1a68c8 (from run-112) | 3.570548412s | 4.967573867s | Bad |
| 430c1a68c8 (manual) | 3.63505091s | 4.96697776s | Bad |
From the above, it seems like there may be 2 regressions here (as it's not a straight jump from 2.6s -> 3.6s) - one b/w "a042ecde36 - 5f7b530d87" and other b/w "a8060ab0a1 - 430c1a68c8". Sigh!
shyamjvs
on 13 Mar 2018
expressing as ranges to get compare links:
a042ecde36...5f7b530
a8060ab0a1...430c1a6
 liggitt
on 13 Mar 2018
liggitt
on 13 Mar 2018
Just obtained the results for manual run against a042ecde36 and it only makes life harder:
3.269330734s (watch), 4.939237532s (pod-startup)
as this probably means it might be a flaky regression.
shyamjvs
on 13 Mar 2018
I'm currently running the test against a042ecde36 once more to verify the possibility that the regression came in even before it.
shyamjvs
on 13 Mar 2018
So here's the result of running against a042ecd again:
2.645592996s (watch), 5.026010032s (pod-startup)
This probably means the regression entered even before run-111 (good news that we have a right end for the bisection now).
I'll now try to pursue for a left end. Run-108 (commit 11104d75f) is a potential candidate, which had the following results when I earlier ran it (with etcd 3.1.11):
2.593628224s (watch), 4.321942836s (pod-startup)
My re-run against commit 11104d7 does seem to say it's a good one:
2.663456162s (watch), 4.288927203s (pod-startup)
I'll take a stab here at bisecting in the range 11104d7...a042ecd
shyamjvs
on 13 Mar 2018
Update: I needed to test the commit 097efb71a315 thrice in order to gain confidence. It shows quite some variance, but seems like a good commit:
2.578970061s (watch), 4.129003596s (pod-startup)
2.315561531s (watch), 4.70792639s (pod-startup)
2.303510957s (watch), 3.88150234s (pod-startup)
I'll continue bisecting further.
That said, there seems to have been another spike (of ~1s) in pod-startup latency just couple of days ago. And this one is pushing the 99% to almost 6s:
My primary suspect from the commit diff is the etcd change from 3.1.11 -> 3.1.12 (https://github.com/kubernetes/kubernetes/pull/60998). I'd wait for the next run (currently in progress) to confirm it wasn't a one-off - but we really need to understand this.
cc @jpbetz @gyuho
shyamjvs
on 14 Mar 2018
Since I'd be on vacation thu-fri this week, I'm pasting instructions to run density test against 5k-node cluster (so someone with access to the project can continue bisection):
# Start with a clean shell.
# Checkout to the right commit.
make quick-release

# Set the project:
gcloud config set project k8s-scale-testing

# Set some configs for creating/testing 5k-node cluster:
export CLOUDSDK_CORE_PRINT_UNHANDLED_TRACEBACKS=1
export KUBE_GCE_ZONE=us-east1-a
export NUM_NODES=5000
export NODE_SIZE=n1-standard-1
export NODE_DISK_SIZE=50GB
export MASTER_MIN_CPU_ARCHITECTURE=Intel\ Broadwell
export ENABLE_BIG_CLUSTER_SUBNETS=true
export LOGROTATE_MAX_SIZE=5G
export KUBE_ENABLE_CLUSTER_MONITORING=none
export ALLOWED_NOTREADY_NODES=50
export KUBE_GCE_ENABLE_IP_ALIASES=true
export TEST_CLUSTER_LOG_LEVEL=--v=1
export SCHEDULER_TEST_ARGS=--kube-api-qps=100
export CONTROLLER_MANAGER_TEST_ARGS=--kube-api-qps=100\ --kube-api-burst=100
export APISERVER_TEST_ARGS=--max-requests-inflight=3000\ --max-mutating-requests-inflight=1000
export TEST_CLUSTER_RESYNC_PERIOD=--min-resync-period=12h
export TEST_CLUSTER_DELETE_COLLECTION_WORKERS=--delete-collection-workers=16
export PREPULL_E2E_IMAGES=false
export ENABLE_APISERVER_ADVANCED_AUDIT=false

# Bring up the cluster (this brings down pre-existing one if present, so you don't have to explicitly '--down' the previous one) and run density test:
go run hack/e2e.go \
--up \
--test \
--test_args='--ginkgo.focus=\[sig\-scalability\]\sDensity\s\[Feature\:Performance\]\sshould\sallow\sstarting\s30\spods\sper\snode\susing\s\{\sReplicationController\}\swith\s0\ssecrets\,\s0\sconfigmaps\sand\s0\sdaemons$ --allowed-not-ready-nodes=30 --node-schedulable-timeout=30m --minStartupPods=8 --gather-resource-usage=master --gather-metrics-at-teardown=master' \
> somepath/build-log.txt 2>&1

# To re-run the test on same cluster (without re-creating) just omit '--up' in the above.
IMPORTANT NOTES:
- Current commit range suspected is ff7918d...a042ecde3 (let's keep this updated as we bisect)
- We need to use etcd-3.1.11 instead of 3.2.14 (to avoid including earlier regression). Change the version in the following files to minimally achieve that:
- cluster/gce/manifests/etcd.manifest
- cluster/images/etcd/Makefile
- hack/lib/etcd.sh
shyamjvs
on 14 Mar 2018
cc: @wojtek-t
jdumars
on 14 Mar 2018
etcd v3.1.12 fixes watch event misses on restore. And this is the only change that we've made from v3.1.11. Does performance test involve anything with etcd restart or multi-node that may trigger snapshot from leader?
gyuho
on 14 Mar 2018
Does performance test involve anything with etcd restart
From the etcd logs, doesn't seem like there was any restart.
multi-node
We're using only single-node etcd in our setup (assuming that's what you asked).
shyamjvs
on 14 Mar 2018
I see. Then, v3.1.11 and v3.1.12 should be no different :0
Will take another look if the second run also shows higher latencies.
gyuho
on 14 Mar 2018
cc: @jpbetz
jdumars
on 14 Mar 2018
Agree with @gyuho that we should try to get a stronger signal on this one given that the only code change to etcd is isolated to restart/recover code.
The only other change is the upgrade of etcd from go1.8.5 to go1.8.7, but I'm doubtful that we'd see a significant performance regression with that.
jpbetz
on 14 Mar 2018
So continuing with the bisection, ff7918d1f seems to be good:
2.246719086s (watch), 3.916350274s (pod-startup)
I'll update the commit range in https://github.com/kubernetes/kubernetes/issues/60589#issuecomment-373051051 accordingly.
shyamjvs
on 14 Mar 2018
Next, commit aa19a1726 seems like a good one, though I'd suggest retrying once again to confirm:
2.715156606s (watch), 4.382527095s (pod-startup)
At this point I'm going to pause the bisection and start my vacation :)
I've downed my cluster to make space for the next run.
shyamjvs
on 15 Mar 2018
Thanks Shyam. I am retrying aa19a172693a4ad60d5a08e9b93557267d259c37.
 wasylkowski-a
on 15 Mar 2018
wasylkowski-a
on 15 Mar 2018
For commit aa19a172693a4ad60d5a08e9b93557267d259c37 I got the following results:
2.47655243s (watch), 4.174016696s (pod-startup)
So this looks good. Continuing bisection.
Current commit range suspected: aa19a172693a4ad60d5a08e9b93557267d259c37...a042ecde362000e51f1e7bdbbda5bf9d81116f84
wasylkowski-a
on 15 Mar 2018
@wasylkowski-a could you attend our release meeting at 5PM UTC/1PM Eastern/10AM Pacific? It's a Zoom meeting: https://zoom.us/j/2018742972
jdumars
on 15 Mar 2018
I will attend.
wasylkowski-a
on 15 Mar 2018
Commit cca7ccbff161255292f72c2d18459cdface62122 looks unclear with the following results:
2.984185673s (watch), 4.568914929s (pod-startup)
I will run this one more time to get confidence I do not enter the wrong half of the bisection.
wasylkowski-a
on 15 Mar 2018
OK, so I'm pretty confident now that cca7ccbff161255292f72c2d18459cdface62122 is bad:
3.285168535s (watch), 4.783986141s (pod-startup)
Trimming the range down to aa19a172693a4ad60d5a08e9b93557267d259c37...cca7ccbff161255292f72c2d18459cdface62122 and trying out 92e4d3da0076f923a45d54d69c84e91ac6a61a55.
wasylkowski-a
on 16 Mar 2018
Commit 92e4d3da0076f923a45d54d69c84e91ac6a61a55 looks good:
2.522438984s (watch), 4.21739985s (pod-startup)
New suspect commit range is 92e4d3da0076f923a45d54d69c84e91ac6a61a55...cca7ccbff161255292f72c2d18459cdface62122, trying out 603ebe466d335a37392315d491782ed18d1bae11
wasylkowski-a
on 16 Mar 2018
@wasylkowski please note that one of the commits namely https://github.com/kubernetes/kubernetes/commit/4c289014a05669c376994868d8d91f7565a204b5 got reverted in https://github.com/kubernetes/kubernetes/commit/493f33583053bb4ce9f7d348c5bac39975883cb8
dims
on 16 Mar 2018
Restating @dims comment more clearly, we may be chasing a signal ghost here in the bisection. If 4c28901 is the problem, and it's reverted at 493f335 already for seemingly unrelated reasons, then does a scalability test against 1.10 branch head show green signal?
Can we prioritize re-testing once against 1.10 branch head, rather than continuing bisection?
 tpepper
on 16 Mar 2018
tpepper
on 16 Mar 2018
@wasylkowski / @wasylkowski-a ^^^^
tpepper
on 16 Mar 2018
@wojtek-t PTAL ASAP
jdumars
on 16 Mar 2018
Thanks @dims and @tpepper. Let my try against 1.10 branch head and see what happens.
wasylkowski-a
on 16 Mar 2018
thanks @wasylkowski worst case we go back to what we were bisecting before. right?
dims
on 16 Mar 2018
1.10 head has a regression:
3.522924087s (watch), 4.946431238s (pod-startup)
This is on etcd 3.1.12, not etcd 3.1.11, but if I understand it correctly this should not make much of a difference.
Also, 603ebe466d335a37392315d491782ed18d1bae11 looks good:
2.744654024s (watch), 4.284582476s (pod-startup)
2.76287483s (watch), 4.326409841s (pod-startup)
2.560703844s (watch), 4.213785531s (pod-startup)
This leaves us with the range 603ebe466d335a37392315d491782ed18d1bae11...cca7ccbff161255292f72c2d18459cdface62122 and there are only 3 commits there. Let me see what I find out.
It is also possible that indeed 4c289014a05669c376994868d8d91f7565a204b5 is the culprit here, but then it means that we have another regression that manifests itself on head.
wasylkowski-a
on 16 Mar 2018
OK, so evidently commit 6590ea6d5d50700d34255b1e037b2702ad26b7fc is good:
2.553170576s (watch), 4.22516704s (pod-startup)
while commit 7b678dc4035c61a1991b5e1442edb13f40deae72 is bad:
3.498855918s (watch), 4.886599251s (pod-startup)
The bad commit is the merge of the reverted commit mentioned by @dims, so we must be observing another regression on head.
Let me try rerunning head on etcd 3.1.11 instead of 3.1.12 and see what happens.
wasylkowski-a
on 17 Mar 2018
@wasylkowski-a ah classic good news bad news :) thanks for keeping this going.
@wojtek-t any other suggestions?
dims
on 17 Mar 2018
Head on etcd 3.1.11 is also bad; my next try will be to try directly after the revert (so, at commit cdecea545553eff09e280d389a3aef69e2f32bf1), but with etcd 3.1.11 instead of 3.2.14.
wasylkowski-a
on 17 Mar 2018
Sounds good Andrzej
-- dims
On Mar 17, 2018, at 1:19 PM, Andrzej Wasylkowski notifications@github.com wrote:
Head on etcd 3.1.11 is also bad; my next try will be to try directly after the revert (so, at commit cdecea5), but with etcd 3.1.11 instead of 3.2.14.
—
You are receiving this because you were mentioned.
Reply to this email directly, view it on GitHub, or mute the thread.
dims
on 17 Mar 2018
Commit cdecea545553eff09e280d389a3aef69e2f32bf1 is good, so we have a later regression:
2.66454307s (watch), 4.308091589s (pod-startup)
Commit 2a373ace6eda6a9cf050ce70a6cf99183c5e5b37 is clearly bad:
3.656979569s (watch), 6.746987916s (pod-startup)
@wasylkowski-a So we are basically looking at commits in the range https://github.com/kubernetes/kubernetes/compare/cdecea5...2a373ac to see what's wrong then? (run bisect between these two)?
dims
on 17 Mar 2018
Yes. This is a huge range, unfortunately. I am right now investigating aded0d922592fdff0137c70443caf2a9502c7580.
wasylkowski-a
on 17 Mar 2018
Thanks @wasylkowski what's the current range? (so i can go look at the PR's).
dims
on 18 Mar 2018
Commit aded0d922592fdff0137c70443caf2a9502c7580 is bad:
3.626257043s (watch), 5.00754503s (pod-startup)
Commit f8298702ffe644a4f021e23a616ad6a8790a5537 is also bad:
3.747051371s (watch), 6.126914967s (pod-startup)
So is commit 20a6749c3f86c7cb9e98442046532380fb5f6e36:
3.641172882s (watch), 5.100922237s (pod-startup)
And so is 0e81651e77e0be7e75179e5986ef2c76601f4bd6:
3.687028394s (watch), 5.208157763s (pod-startup)
Current range is cdecea545553eff09e280d389a3aef69e2f32bf1...0e81651e77e0be7e75179e5986ef2c76601f4bd6. We (me, @wojtek-t, @shyamjvs) are starting to suspect that cdecea545553eff09e280d389a3aef69e2f32bf1 is in fact a flaky pass, so we need a different left end.
wasylkowski-a
on 19 Mar 2018
/me places bet on https://github.com/kubernetes/kubernetes/commit/b259543985b10875f4a010ed0285ac43e335c8e0 as the culprit
cc @wasylkowski-a
dims
on 19 Mar 2018
0e81651e77e0be7e75179e5986ef2c76601f4bd6 is, turns out, bad, so b259543985b10875f4a010ed0285ac43e335c8e0 (merged as 244549f02afabc5be23fc56e86a60e5b36838828, after 0e81651e77e0be7e75179e5986ef2c76601f4bd6) cannot be the earliest culprit (though it is not impossible that it has introduced yet another regression we will observe once we shake out this one)
wasylkowski-a
on 19 Mar 2018
Per @wojtek-t and @shyamjvs I am rerunning cdecea545553eff09e280d389a3aef69e2f32bf1, because we suspect this might have been a "flaky good"
wasylkowski-a
on 19 Mar 2018
I will assume that cdecea545553eff09e280d389a3aef69e2f32bf1 is actually good based on the following results I have observed:
2.66454307s (watch), 4.308091589s (pod-startup)
2.695629257s (watch), 4.194027608s (pod-startup)
2.660956347s (watch), 3m36.62259323s (pod-startup) <-- looks like an outlier
2.865445137s (watch), 4.594671099s (pod-startup)
2.412093606s (watch), 4.070130529s (pod-startup)
Currently suspected range: cdecea545553eff09e280d389a3aef69e2f32bf1...0e81651e77e0be7e75179e5986ef2c76601f4bd6
Currently testing 99c87cf679e9cbd9647786bf7e81f0a2d771084f
wasylkowski-a
on 20 Mar 2018
Thank you @wasylkowski for continuing this work.
jdumars
on 20 Mar 2018
per discussion today: fluentd-scaler still has issues: https://github.com/kubernetes/kubernetes/issues/61190, which have not been fixed by PRs. Is it possible that this regression is caused by fluentd?
 jberkus
on 20 Mar 2018
jberkus
on 20 Mar 2018
one of the PRs relating to fluentd https://github.com/kubernetes/kubernetes/commit/a88ddac1e47e0bc4b43bfa1b0df2f19aea4455f2 is in the latest range
dims
on 20 Mar 2018
per discussion today: fluentd-scaler still has issues: #61190, which have not been fixed by PRs. Is it possible that this regression is caused by fluentd?
TBH, I would be really surprised if it would be due to fluentd issues. But I can't exclude this hypothesis for sure.
My personal feeling would be some change in Kubelet, but I also looked into PRs in that range and nothing seems really suspicious...
Hopefully the range will be 4x smaller tomorrow, which would mean just couple PRs.
wojtek-t
on 20 Mar 2018
OK, so 99c87cf679e9cbd9647786bf7e81f0a2d771084f looks good, but I needed three runs to ensure this is not a flake:
2.901624657s (watch), 4.418169754s (pod-startup)
2.938653965s (watch), 4.423465198s (pod-startup)
3.047455619s (watch), 4.455485098s (pod-startup)
Next, a88ddac1e47e0bc4b43bfa1b0df2f19aea4455f2 is bad:
3.769747695s (watch), 5.338517616s (pod-startup)
Current range is 99c87cf679e9cbd9647786bf7e81f0a2d771084f...a88ddac1e47e0bc4b43bfa1b0df2f19aea4455f2. Analyzing c105796e4ba7fc9cfafc2e7a3cc4a556d7d9defd.
wasylkowski-a
on 20 Mar 2018
I looked into the range mentioned above - there are only 9 PRs there.
https://github.com/kubernetes/kubernetes/pull/59944 - 100% NOT - only changes owners file
https://github.com/kubernetes/kubernetes/pull/59953 - potentially
https://github.com/kubernetes/kubernetes/pull/59809 - only touching kubectl code, so shouldn't matter for this case
https://github.com/kubernetes/kubernetes/pull/59955 - 100% NOT - only touching unrelated e2e tests
https://github.com/kubernetes/kubernetes/pull/59808 - potentially (it changes cluster setup)
https://github.com/kubernetes/kubernetes/pull/59913 - 100% NOT - only touching unrelated e2e tests
https://github.com/kubernetes/kubernetes/pull/59917 - it is changing the test, but not switching the changes on, so unlikely
https://github.com/kubernetes/kubernetes/pull/59668 - 100% NOT - only touching AWS code
https://github.com/kubernetes/kubernetes/pull/59909 - 100% NOT - only touching owners files
So I think we have two candidates here: https://github.com/kubernetes/kubernetes/pull/59953 and https://github.com/kubernetes/kubernetes/pull/59808
I will try to dig deeper into those to understand them.
wojtek-t
on 21 Mar 2018
c105796e4ba7fc9cfafc2e7a3cc4a556d7d9defd looks rather bad:
3.428891786s (watch), 4.909251611s (pod-startup)
Given that this is merge of #59953, one of Wojtek's suspects, I will now run on one commit before that, so f60083549a43f152b3142e01756e25611d911770.
That commit, though, is OWNERS_ALIASES change, and there is nothing left in that range before it, so c105796e4ba7fc9cfafc2e7a3cc4a556d7d9defd must be the problem. I will run the test just for safety, anyway.
wasylkowski-a
on 21 Mar 2018
Discussed offline - we will run tests at head with this commit locally reverted instead.
wojtek-t
on 21 Mar 2018
wow! a one liner causing so much trouble. thanks @wasylkowski @wojtek-t
dims
on 21 Mar 2018
@dims One-liners can indeed cause devastation with scalability. Another e.g from past - https://github.com/kubernetes/kubernetes/pull/53720#issue-145949976
In general, you might want to see https://github.com/kubernetes/community/blob/master/sig-scalability/blogs/scalability-regressions-case-studies.md for a good read :)
shyamjvs
on 21 Mar 2018
Update re. test at head: first run with the commit locally reverted passed. This might be a flake, though, so I am rerunning it.
wasylkowski-a
on 21 Mar 2018
Looking at the commit in https://github.com/kubernetes/kubernetes/pull/59953... wasn't it fixing a bug? It appears to have been fixing a bug placing "scheduled" status into the wrong object. Based on the referenced issue in that PR, it looks like the kubelet could miss reporting a pod was scheduled without that fix?
liggitt
on 21 Mar 2018
@Random-Liu Who may be able to explain us better what's the effect of that change :)
shyamjvs
on 21 Mar 2018
Looking at the commit in #59953... wasn't it fixing a bug? It appears to have been fixing a bug placing "scheduled" status into the wrong object. Could the kubelet have been reporting a pod was scheduled too early before that fix?
Yeah - I know it was a bug fix. I just don't fully understand that.
It seems to fix the problem of pod reporting as "Scheduled". But we don't see the problem even until time that is reported by kubelet as "StartedAt".
The problem is that we see signifcant increase between time reported as "StartedAt" by Kubelet and when pod status update is being reported and watched by the test.
So I think the "Scheduled" bit is a red-herring here.
My guess (but this is still only just a guess) is that due to this change we are sending more Pod status updates, which in turn is resulting in more 429s or or sth like that. And in the end it takes more time for a Kubelet to report the pod status. But that's something we still need to confirm.
wojtek-t
on 21 Mar 2018
After two runs I am pretty confident that reverting #59953 fixes the problem:
3.052567319s (watch), 4.489142104s (pod-startup)
2.799364978s (watch), 4.385999497s (pod-startup)
we are sending more Pod status updates, which in turn is resulting in more 429s or or sth like that. And in the end it takes more time for a Kubelet to report the pod status.
This is pretty much the effect I was hypothesizing in https://github.com/kubernetes/kubernetes/issues/60589#issuecomment-370573938 (though the cause I guessed was wrong) :)
Also, we IIRC did seem to see an increase in # of 429s for put calls (see my https://github.com/kubernetes/kubernetes/issues/60589#issuecomment-370582634) but that was from an earlier range I think (around etcd change).
shyamjvs
on 21 Mar 2018
After two runs I am pretty confident that reverting #59953 fixes the problem:
My intuition (https://github.com/kubernetes/kubernetes/issues/60589#issuecomment-370874602) about issue being on kubelet side quite early-on in the thread was correct after all :)
shyamjvs
on 21 Mar 2018
/sig node
@kubernetes/sig-node-bugs the release team could really use review on #59953 commit versus revert and the performance issue here
tpepper
on 21 Mar 2018
Looking at the commit in #59953... wasn't it fixing a bug? It appears to have been fixing a bug placing "scheduled" status into the wrong object. Based on the referenced issue in that PR, it looks like the kubelet could miss reporting a pod was scheduled without that fix?
@liggitt Thanks for explaining this for me. Yeah, that PR is fixing a bug. Previously, kubelet didn't always set PodScheduled. With #59953, kubelet will do that correctly.
@shyamjvs I'm not sure whether it could introduce more pod status update.
If I understand correctly, PodScheduled condition will be set in the first status update and then it will always be there and never changed. I don't understand why it generates more status update.
If it really does introduce more status update, it is a problem introduced 2 years ago https://github.com/kubernetes/kubernetes/pull/24459 but covered by a bug, and #59953 just fix the bug...
@wasylkowski-a Do you have logs for the 2 test run in https://github.com/kubernetes/kubernetes/issues/60589#issuecomment-374982422 and https://github.com/kubernetes/kubernetes/issues/60589#issuecomment-374871490? Basically a good one and a bad one. The kubelet.log will be very helpful.
 Random-Liu
on 21 Mar 2018
Random-Liu
on 21 Mar 2018
@yujuhong and I found that #59953 exposed an issue that PodScheduled condition of static pod will keep getting updated.
Kubelet generates a new PodScheduled condition for pod which doesn't have it. Static pod doesn't have it, and its status is never updated (expected behavior). Thus kubelet will keep generating new PodScheduled condition for static pod.
The issue was introduced in #24459, but covered by a bug. #59953 fixed the bug, and exposed the original issue.
There are 2 options to quickly fix this:
- Option 1: Don't let kubelet add
PodScheduledcondition, kubelet should just preservesPodScheduledcondition set by scheduler.
- Pros: Simple.
- Cons: Static pod and pod which by-passes scheduler (assign node name directly) won't have
PodScheduledcondition. Actually without #59953, although kubelet will eventually set this condition for those pods, but it may take a very long time because of a bug.
- Option 2: Generate a
PodScheduledcondition for static pod when kubelet sees it initially.
Option 2 might introduce less user facing change.
But we do want to ask what PodScheduled mean to pods which are not scheduled by scheduler? Do we really need this condition for those pods? /cc @kubernetes/sig-autoscaling-bugs Because @yujuhong told me that PodScheduled is used by autoscaling now.
/cc @kubernetes/sig-node-bugs @kubernetes/sig-scheduling-bugs
Random-Liu
on 21 Mar 2018
@Random-Liu What is the effect of the very long time for kubelet to eventually set this condition? What problem will an end user notice/face (outside of the test harness flakiness)? (from Option #1)
dims
on 21 Mar 2018
@dims User won't see PodScheduled condition for a long time.
Random-Liu
on 21 Mar 2018
I have a fix #61504 which implements option 2 in https://github.com/kubernetes/kubernetes/issues/60589#issuecomment-375103979.
I can change it to option 1 if people think that is a better fix. :)
Random-Liu
on 21 Mar 2018
you better ask folks who know this inside out! (NOT the release team 😄!)
ping @dashpole @dchen1107 @derekwaynecarr
dims
on 21 Mar 2018
@Random-Liu IIRC the only static pod running on nodes in our tests is kube-proxy. Could you tell how frequently are these 'continuous updates' made by kubelet? (asking in order to estimate extra qps introduced by the bug)
shyamjvs
on 21 Mar 2018
@Random-Liu IIRC the only static pod running on nodes in our tests is kube-proxy. Could you tell how frequently are these 'continuous updates' made by kubelet? (asking in order to estimate extra qps introduced by the bug)
@shyamjvs Yeah, kube-proxy is the only one on node now.
I think it depends on pod sync frequency https://github.com/kubernetes/kubernetes/blob/master/pkg/kubelet/apis/kubeletconfig/v1beta1/defaults.go#L47, which is 1 minute. So kubelet generates one extra pod status update every 1 minute.
Random-Liu
on 22 Mar 2018
Thanks. So that means 5000/60 = ~83 qps added extra due to those put pod-status calls. Seems to explain the increased 429s noted earlier in the bug.
shyamjvs
on 22 Mar 2018
@Random-Liu thank you very much for helping us get this sorted.
jdumars
on 22 Mar 2018
@jdumars np~ @yujuhong helped me a lot!
Random-Liu
on 22 Mar 2018
But we do want to ask what PodScheduled mean to pods which are not scheduled by scheduler? Do we really need this condition for those pods? /cc @kubernetes/sig-autoscaling-bugs Because @yujuhong told me that PodScheduled is used by autoscaling now.
I still think letting kubelet set the PodScheduled condition is somewhat strange (as I noted in the original PR). Even if kubelet doesn't set this condition, it'd not affect the cluster autoscaler since the autoscaler ignores the pods without the specific condition. Anyway, the fix we eventually came up has very minor footprint, and would maintain the current behavior (i.e., always setting the PodScheduled condition), so we'll go with that.
 yujuhong
on 22 Mar 2018
yujuhong
on 22 Mar 2018
Also, revived the really old issue for adding tests for steady-state pod update rate #14391
yujuhong
on 22 Mar 2018
Anyway, the fix we eventually came up has very minor footprint, and would maintain the current behavior (i.e., always setting the PodScheduled condition), so we'll go with that.
@yujuhong - are you talking about this one: #61504 (or do I misunderstand it)?
@wasylkowski @shyamjvs - can you please run 5000-node tests with that PR patched locally (before we merge it) to ensure that this really helps?
wojtek-t
on 22 Mar 2018
I ran the test against 1.10 HEAD + #61504, and the pod-startup latency seems to be fine:
INFO: perc50: 2.594635536s, perc90: 3.483550118s, perc99: 4.327417676s
Will re-run once more to confirm.
shyamjvs
on 22 Mar 2018
@shyamjvs - thanks a lot!
wojtek-t
on 22 Mar 2018
Second run also seems good:
INFO: perc50: 2.583489146s, perc90: 3.466873901s, perc99: 4.380595534s
Fairly confident now the fix did the trick. Let's get it into 1.10 asap.
shyamjvs
on 22 Mar 2018
Thanks @shyamjvs
As we talked offline - I think we had one more regression in the last month or so, but that one shouldn't block the release.
wojtek-t
on 22 Mar 2018
@yujuhong - are you talking about this one: #61504 (or do I misunderstand it)?
Yep. The current fix in that PR is not in the options proposed initially in https://github.com/kubernetes/kubernetes/issues/60589#issuecomment-375103979
yujuhong
on 22 Mar 2018
re-opening until we have a good performance test result.
jberkus
on 25 Mar 2018
@yujuhong @krzyzacy @shyamjvs @wojtek-t @Random-Liu @wasylkowski-a any updates on this? This is still blocking 1.10 at the moment.
jdumars
on 26 Mar 2018
So the only part of this bug that was blocking the release is the 5k-node performance job. Unfortunately, we lost our run from today due to a different reason (ref: https://github.com/kubernetes/kubernetes/issues/61190#issuecomment-376150569)
That said, we're fairly confident the fix works based on my manual runs (results pasted in https://github.com/kubernetes/kubernetes/issues/60589#issuecomment-375350217). So IMHO we don't need to block release on it (the next run's going to be on wed).
shyamjvs
on 26 Mar 2018
+1
@jdumars - I think we can treat this as non-blocker.
wojtek-t
on 26 Mar 2018
Sorry, I edited my post above. I meant that we should treat it as "non-blocker".
wojtek-t
on 26 Mar 2018
Ok, thank you very much. This conclusion represents a tremendous amount of hours you have invested, and I cannot possibly thank you all enough for the work you have done. While we talk in the abstract about "community" and "contributors" you, and the others who have worked this issue represent it in concrete terms. You are the very heart and soul of this project, and I know I speak for everyone involved when I say it is an honor to work alongside such passion, commitment, and professionalism.
jdumars
on 26 Mar 2018
[MILESTONENOTIFIER] Milestone Issue: Up-to-date for process
@krzyzacy @msau42 @shyamjvs @wojtek-t
Issue Labels
sig/api-machinerysig/autoscalingsig/nodesig/scalabilitysig/schedulingsig/storage: Issue will be escalated to these SIGs if needed.priority/critical-urgent: Never automatically move issue out of a release milestone; continually escalate to contributor and SIG through all available channels.kind/bug: Fixes a bug discovered during the current release.
Help
 k8s-github-robot
on 11 Apr 2018
k8s-github-robot
on 11 Apr 2018
This issue was resolved with the relevant fixes in for 1.10.
For 1.11, we're tracking the failures under - https://github.com/kubernetes/kubernetes/issues/63030.
/close
shyamjvs
on 25 May 2018
Related issues
 mml
·
3Comments
mml
·
3Comments
 sanjana-bhat
·
3Comments
sanjana-bhat
·
3Comments
 cooligc
·
3Comments
cooligc
·
3Comments
 theothermike
·
3Comments
theothermike
·
3Comments
 alexferl
·
3Comments
alexferl
·
3Comments
Most helpful comment
I ran the test against 1.10 HEAD + #61504, and the pod-startup latency seems to be fine:
Will re-run once more to confirm.