Summary.
Expected Result
Program running normally
Actual Result
Program consuming all ram till stops working
Reproduction Steps
Pseudocode:
def function():
    proxies = {
        'https': proxy
    }
    session = requests.Session()
    session.headers.update({'User-Agent': 'user - agent'})
    try:                                           #
        login = session.get(url, proxies=proxies)  # HERE IS WHERE MEMORY LEAKS
    except:                                        #
        return -1                                  #
    return 0
System Information
$ python -m requests.help
{
  "chardet": {
    "version": "3.0.4"
  },
  "cryptography": {
    "version": ""
  },
  "idna": {
    "version": "2.6"
  },
  "implementation": {
    "name": "CPython",
    "version": "3.6.3"
  },
  "platform": {
    "release": "10",
    "system": "Windows"
  },
  "pyOpenSSL": {
    "openssl_version": "",
    "version": null
  },
  "requests": {
    "version": "2.18.4"
  },
  "system_ssl": {
    "version": "100020bf"
  },
  "urllib3": {
    "version": "1.22"
  },
  "using_pyopenssl": false
}
 Munroc
All 22 comments
Please provide us with the output of
python -m requests.help
If that is unavailable on your version of Requests please provide some basic information about your system (Python version, operating system, etc).
 sigmavirus24
on 20 Apr 2018
sigmavirus24
on 20 Apr 2018
@sigmavirus24 Done
Munroc
on 20 Apr 2018
Hey @munroc, a couple quick questions about your threading implementation since it’s not included in the pseudo code.
Are you creating a new session for every thread and what size is the threadpool you're using?
What tool are you using to determine where the leak is coming from? Would you mind sharing the results?
We’ve had hints of memory leaks around sessions for a while now, but I’m not sure we’ve found a smoking gun or truly confirmed impact.
 nateprewitt
on 20 Apr 2018
nateprewitt
on 20 Apr 2018
@nateprewitt Hello, yes im creating a new session for every thread. The thread pool is 30. I have tryied with 2 - 200 threads and memory leaks anyway. Im not using a tool, i just did this changes to the function:
put return 0 before login = session.get and no memory leak. if i put return 0 after login = session.get memory starts leaking. If you want i can send you my source code is not too large.
Munroc
on 20 Apr 2018
@Munroc if we have the full code, then I think it would be easier to isolate the actual cause. But based on the code gist that was provided, I think it is very hard to conclude that there is a memory leak.
As you have mentioned, if you return immediately before calling session.get, then only proxies and session objects will exist in the memory (oversimplified.. but I hope you get the idea :smile:). However, once you call session.get(url, proxies=proxies), the HTML of the url will be retrieved and locally saved to the login variable. Which means, each session.get call will "look like" they are leaking memory, but they are actually behaving normally by (memory) linearly increasing by the size of url result.
However, let's say that you were using threads and .join() them immediately afterwards. In that case, I think we need to look at how your threads were managed - and whether they were closed/cleaned properly.
 initbar
on 21 May 2018
initbar
on 21 May 2018
@LeoSZN I think in your specific example, you're closing only the last Process object after generating multiple Process per urls elements.
Could you try daemonizing them using p.daemon = True and run them (so that once the main thread terminates, all the spawned child processes dies also)? Otherwise, store the spawned processes in a separate array and make sure to close all of them using a loop.
initbar
on 14 Oct 2018
@initbar
Do I need to run p.daemon = True in the loop or outside the loop before p.join() ? By the way do I still need p.join() after applying p.daemon = True ?
 leoszn
on 15 Oct 2018
leoszn
on 15 Oct 2018
_Ook, I was kicked from the new topic to this one, so let me join yours.
May be this issue provide more information and will step up the issue solving..._
I'm running Telegram bot and noticed the free memory degradation when running bot for a long time. Firstly, I suspect my code; then I suspect bot and finally I came to requests. :)
I used len(gc.get_objects()) to identify that problem exists. I located the communication routines, then cleared all bot code and comes to the example that raises the count of gc objects on every iteration.
Expected Result
len(gc.get_objects()) should give the same result on every loop iteration
Actual Result
The value of len(gc.get_objects()) increases on every loop iteration.
Test N2
GetObjects len: 27959
Test N3
GetObjects len: 27960
Test N4
GetObjects len: 27961
Test N5
GetObjects len: 27962
Test N6
GetObjects len: 27963
Test N7
GetObjects len: 27964
Reproduction Steps
token = "XXX:XXX"
chat_id = '111'
proxy = {'https':'socks5h://ZZZ'} #You may need proxy to run this in Russia
from time import sleep
import gc, requests
def garbage_info():
res = ""
res += "\nGetObjects len: " + str(len(gc.get_objects()))
return res
def tester():
count = 0
while(True):
sleep(1)
count += 1
msg = "\nTest N{0}".format(count) + garbage_info()
print(msg)
method_url = r'sendMessage'
payload = {'chat_id': str(chat_id), 'text': msg}
request_url = "https://api.telegram.org/bot{0}/{1}".format(token, method_url)
method_name = 'get'
session = requests.session()
req = requests.Request(
method=method_name.upper(),
url=request_url,
params=payload
)
prep = session.prepare_request(req)
settings = session.merge_environment_settings(
prep.url, None, None, None, None)
# prep.url, proxy, None, None, None) #Change the line to enable proxy
send_kwargs = {
'timeout': None,
'allow_redirects': None,
}
send_kwargs.update(settings)
resp = session.send(prep, **send_kwargs)
# For more clean output
gc.collect()
tester()
System Information
{
"chardet": {
"version": "3.0.4"
},
"cryptography": {
"version": "2.3.1"
},
"idna": {
"version": "2.7"
},
"implementation": {
"name": "CPython",
"version": "3.6.6"
},
"platform": {
"release": "4.15.0-36-generic",
"system": "Linux"
},
"pyOpenSSL": {
"openssl_version": "1010009f",
"version": "17.5.0"
},
"requests": {
"version": "2.19.1"
},
"system_ssl": {
"version": "1010007f"
},
"urllib3": {
"version": "1.23"
},
"using_pyopenssl": true
}
_The same behaviour I had on Python 3.5.3 on Windows10._
 Badiboy
on 16 Oct 2018
Badiboy
on 16 Oct 2018
@LeoSZN
@initbar
Do I need to run
p.daemon = Truein the loop or outside the loop beforep.join()? By the way do I still needp.join()after applyingp.daemon = True?
# ..
for i in urls:
p = Process(target=main, args=(i,))
p.daemon = True # before `.start`
p.start()
# ..
As a minor note, you can still .join daemon processes -- but they are near-guaranteed to be killed when their parent process terminates (unless they somehow become unintentionally orphaned; in which case, please let me know! I've love to learn more about it).
Otherwise, you can store the Process objects separately as an array and join in the end:
# ..
processes = [
Process(target=main, args=(i,))
for i in urls
]
# start the process activity.
Expected Result
len(gc.get_objects()) should give the same result on every loop iteration
The reason of this behaviour was found in "requests" cache mechanism.
It works incorrect (suspected): it adds a cache record to every call to Telegram API URL (instead of caching it once). But it does not lead to the memory leak, because cache size is limited to 20 and cache is resetting after reaching this limit and the growing number of objects will be decreased back to initial value.
Badiboy
on 26 Oct 2018
Similar issue. Requests eats memory when running in thread. Code to reproduce here:
import gc
from concurrent.futures import ThreadPoolExecutor, as_completed
import requests
from memory_profiler import profile

def run_thread_request(sess, run):
    response = sess.get('https://www.google.com')
    return

@profile
def main():
    sess = requests.session()
    with ThreadPoolExecutor(max_workers=1) as executor:
        print('Starting!')
        tasks = {executor.submit(run_thread_request, sess, run):
                    run for run in range(50)}
        for _ in as_completed(tasks):
            pass
    print('Done!')
    return

@profile
def calling():
    main()
    gc.collect()
    return

if __name__ == '__main__':
    calling()
In the code given above I pass a session object around, but if I replace it with just running requests.get nothing changes.
Output is:
➜  thread-test pipenv run python run.py
Starting!
Done!
Filename: run.py

Line #    Mem usage    Increment   Line Contents
================================================
    10     23.2 MiB     23.2 MiB   @profile
    11                             def main():
    12     23.2 MiB      0.0 MiB       sess = requests.session()
    13     23.2 MiB      0.0 MiB       with ThreadPoolExecutor(max_workers=1) as executor:
    14     23.2 MiB      0.0 MiB           print('Starting!')
    15     23.4 MiB      0.0 MiB           tasks = {executor.submit(run_thread_request, sess, run):
    16     23.4 MiB      0.0 MiB                       run for run in range(50)}
    17     25.8 MiB      2.4 MiB           for _ in as_completed(tasks):
    18     25.8 MiB      0.0 MiB               pass
    19     25.8 MiB      0.0 MiB       print('Done!')
    20     25.8 MiB      0.0 MiB       return


Filename: run.py

Line #    Mem usage    Increment   Line Contents
================================================
    22     23.2 MiB     23.2 MiB   @profile
    23                             def calling():
    24     25.8 MiB      2.6 MiB       main()
    25     25.8 MiB      0.0 MiB       gc.collect()
    26     25.8 MiB      0.0 MiB       return
And Pipfile looks like this:
[[source]]
url = "https://pypi.python.org/simple"
verify_ssl = true

[requires]
python_version = "3.6"

[packages]
requests = "==2.21.0"
memory-profiler = "==0.55.0"
 jotunskij
on 17 Dec 2018
jotunskij
on 17 Dec 2018
FWIW I am also experiencing a similar memory leak as @jotunskij here is more info
 pawel-lmcb
on 26 Mar 2019
pawel-lmcb
on 26 Mar 2019
I also do have same issue where using requests.get with threading actually eats up the memory by around 0.1 - 0.9 per requests and it is not "clearing" itself after the requests but saves it.
 BarryThrill
on 5 May 2019
BarryThrill
on 5 May 2019
Same here, any work around?
 popjxc
on 13 Jun 2019
popjxc
on 13 Jun 2019
Edit
My issue looks to be due to using verify=False in requests, I've raised a bug under #5215
Having the same issue. I have a simple script that spawns a thread, this thread calls a function that runs a while loop, this loop queries an API to check a status value and then sleeps for 10 seconds and then the loop will run again until the script is stopped.
When using the requests.get function I can see the memory usage slowly creeping up via task manager by watching the spawned process.
But if I remove the requests.get call from the loop or use urllib3 directly to make the get request, there is very little if any creep of the memory usage.
I've watched this over a two hour period in both cases and when using requests.get the memory usage is at 1GB+ after two hours where as when using urllib3 the memory usage is at approx. 20mb after two hours.
Python 3.7.4 and requests 2.22.0
 tallona
on 27 Sep 2019
tallona
on 27 Sep 2019
It seems Requests is still in beta stage having memory leaks like that. Come on, guys, patch this up! 😉👍
 PedanticHacker
on 1 Oct 2019
PedanticHacker
on 1 Oct 2019
Any update on this? Simple POST request with a file upload also creates the similar issue of the memory leak.
 MuhammadAliShahzad
on 2 Oct 2019
MuhammadAliShahzad
on 2 Oct 2019
Same for me... leakage while on threadpool execution is on Windows python38 too.
requests 2.22.0
 far-rainbow
on 9 Dec 2019
far-rainbow
on 9 Dec 2019
Same for me
 sunnyjiechao
on 13 Jan 2020
sunnyjiechao
on 13 Jan 2020
Here is my memory leaking issue, anyone can help ? https://stackoverflow.com/questions/59746125/memory-keep-growing-when-using-mutil-thread-download-file
sunnyjiechao
on 16 Jan 2020
Call Session.close() and Response.close() can avoid the memory leak.
And ssl will consume more memory so the memory leak will more remarkable when request https urls.
First I make 4 test cases:
- requests + ssl (https://)
- requests + non-ssl (http://)
- aiohttp + ssl (https://)
- aiohttp + non-ssl (http://)
Pseudo code:
def run(url):
    session = requests.session()
    response = session.get(url)

while True:
    for url in urls:  # about 5k urls of public websites
        # execute in thread pool, size=10
        thread_pool.submit(run, url)

# in another thread, record memory usage every seconds
Memory usage graph(y-axis: MB, x-axis: time), requests use lots of memory and memory increase very fast, while aiohttp memory usage is stable:
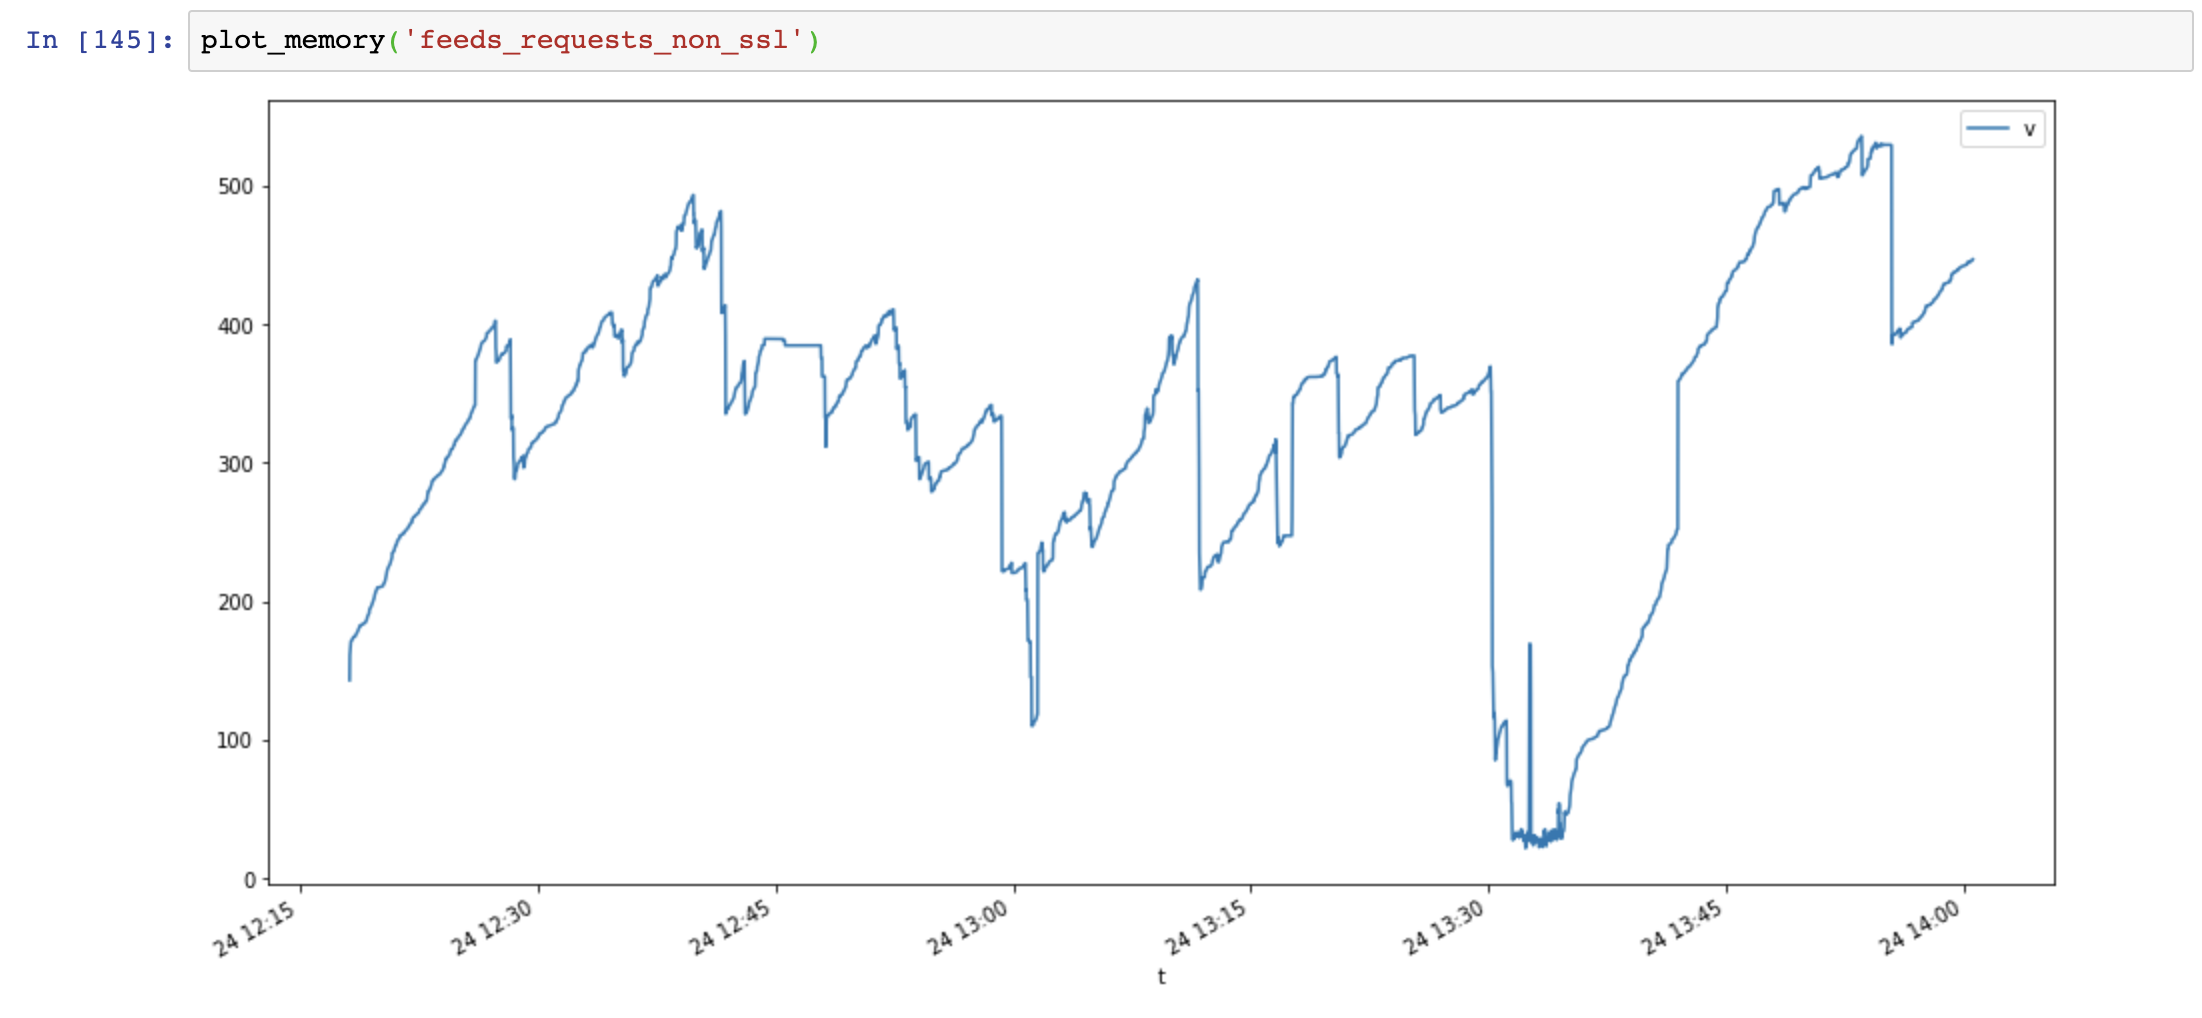


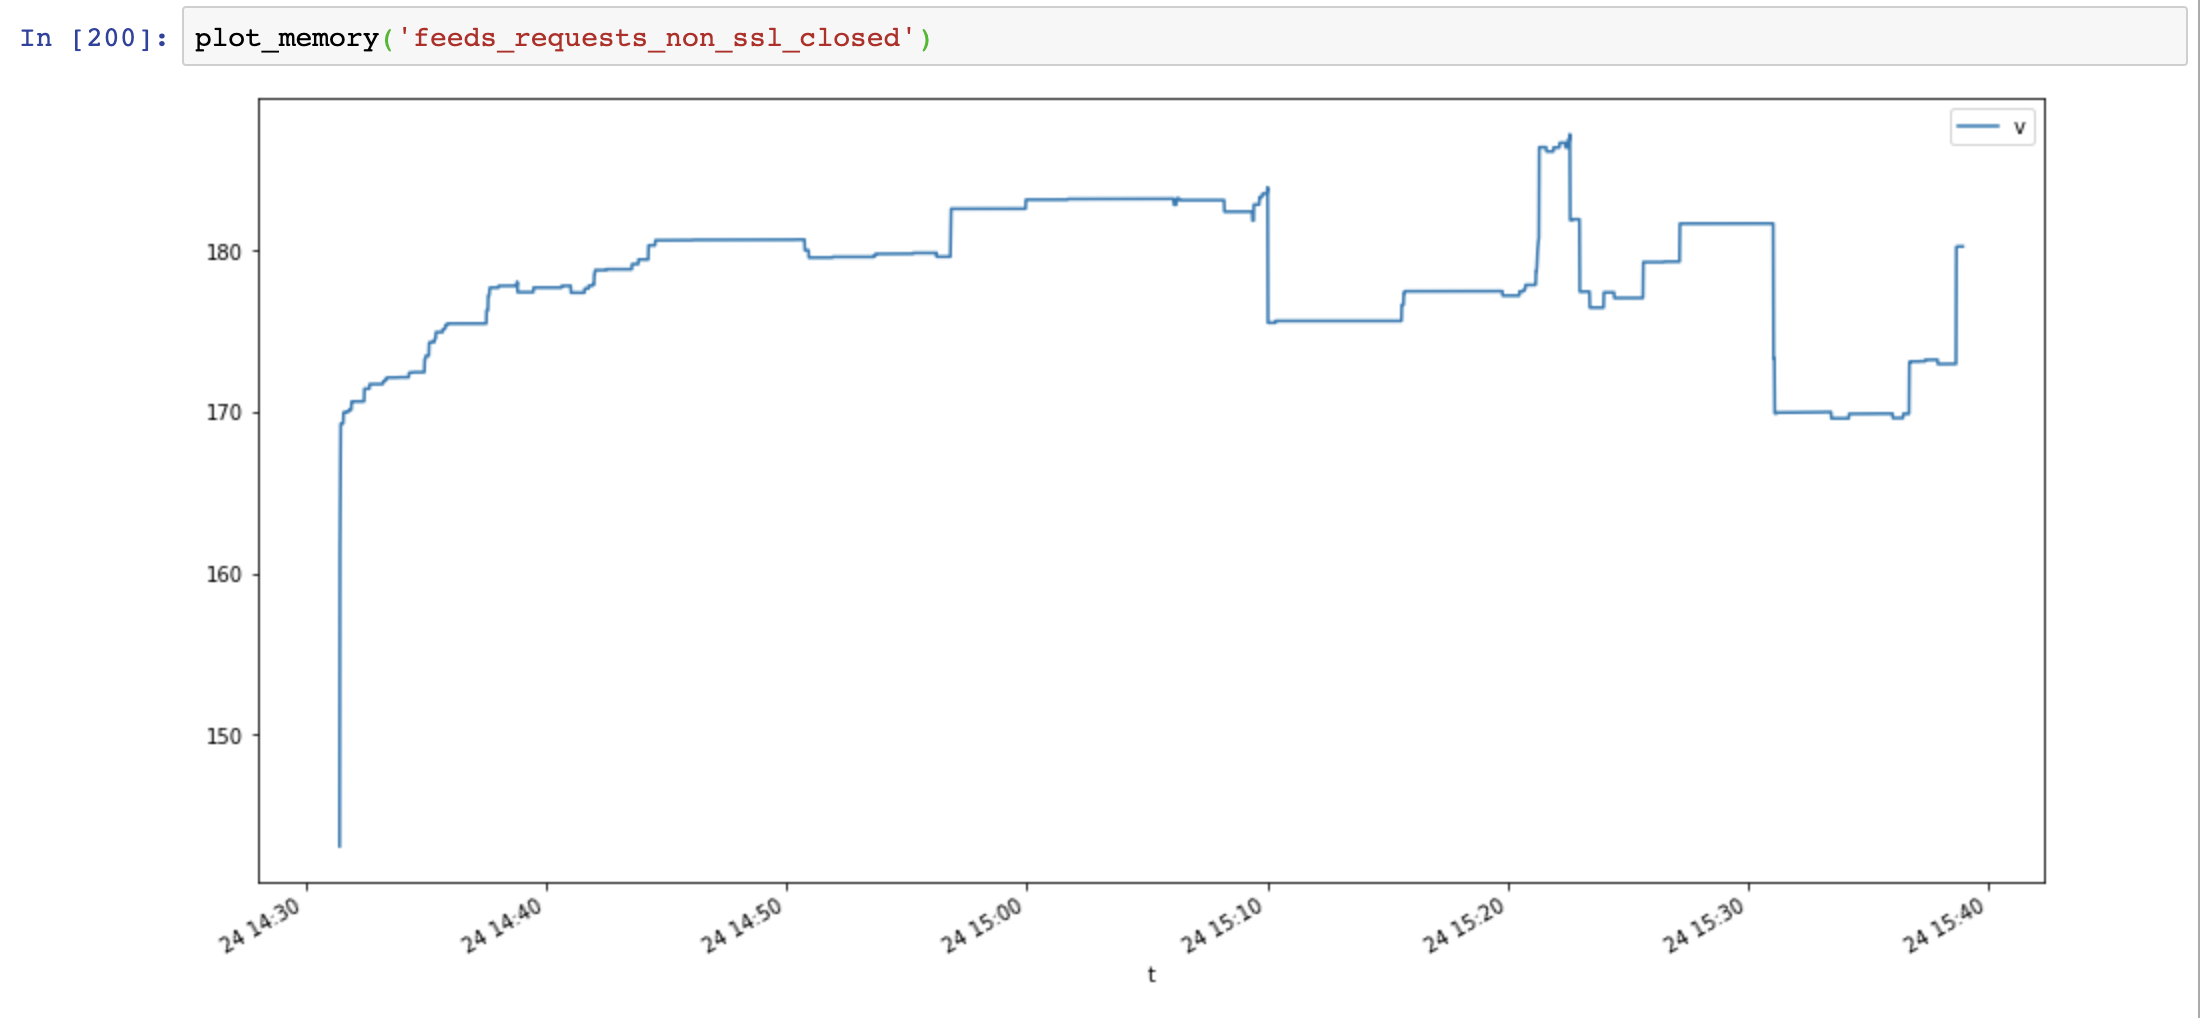
Then I add Session.close() and test again:
def run(url):
    session = requests.session()
    response = session.get(url)
    session.close()  # close session !!
Memory usage significant decreased, but memory usage still increase over time:


Finally I add Response.close() and test again:
def run(url):
    session = requests.session()
    response = session.get(url)
    session.close()  # close session !!
    response.close()  # close response !!
Memory usage decreased again, and not increase over time:

Compare aiohttp and requests shows memory leak is not caused by ssl, it's caused by connection resources not closed.
Useful scripts:
class MemoryReporter:
    def __init__(self, name):
        self.name = name
        self.file = open(f'memoryleak/memory_{name}.txt', 'w')
        self.thread = None

    def _get_memory(self):
        return psutil.Process().memory_info().rss

    def main(self):
        while True:
            t = time.time()
            v = self._get_memory()
            self.file.write(f'{t},{v}\n')
            self.file.flush()
            time.sleep(1)

    def start(self):
        self.thread = Thread(target=self.main, name=self.name, daemon=True)
        self.thread.start()


def plot_memory(name):
    filepath = 'memoryleak/memory_{}.txt'.format(name)
    df_mem = pd.read_csv(filepath, index_col=0, names=['t', 'v'])
    df_mem.index = pd.to_datetime(df_mem.index, unit='s')
    df_mem.v = df_mem.v / 1024 / 1024
    df_mem.plot(figsize=(16, 8))
System Information:
$ python -m requests.help
{
  "chardet": {
    "version": "3.0.4"
  },
  "cryptography": {
    "version": ""
  },
  "idna": {
    "version": "2.8"
  },
  "implementation": {
    "name": "CPython",
    "version": "3.7.4"
  },
  "platform": {
    "release": "18.0.0",
    "system": "Darwin"
  },
  "pyOpenSSL": {
    "openssl_version": "",
    "version": null
  },
  "requests": {
    "version": "2.22.0"
  },
  "system_ssl": {
    "version": "1010104f"
  },
  "urllib3": {
    "version": "1.25.6"
  },
  "using_pyopenssl": false
}
 guyskk
on 24 Mar 2020
guyskk
on 24 Mar 2020
SSL leak problem is packaged OpenSSL <= 3.7.4 on Windows and OSX, its not releasing the memory from the context properly
https://github.com/VeNoMouS/cloudscraper/issues/143#issuecomment-613092377
 VeNoMouS
on 13 Apr 2020
VeNoMouS
on 13 Apr 2020
Related issues
 Matt3o12
·
3Comments
Matt3o12
·
3Comments
 cnicodeme
·
3Comments
cnicodeme
·
3Comments
 iLaus
·
3Comments
iLaus
·
3Comments
 8key
·
3Comments
8key
·
3Comments
 xsren
·
3Comments
xsren
·
3Comments
Most helpful comment
Similar issue. Requests eats memory when running in thread. Code to reproduce here:
In the code given above I pass a session object around, but if I replace it with just running
requests.getnothing changes.Output is:
And Pipfile looks like this: