I'm using this to track investigations into the cause of low FPS values when using immersive mode on devices.
 jdm
jdm
All 71 comments
Some information that has been uncovered:
- there are long waits between xrWaitFrame and xrBeginFrame
- in the demo app these occur sequentially
- in Servo's model, we wait for a device frame, then once we receive the rendered from from the webgl thread we begin the next openxr frame
A trace of the paint demo with markers for the OpenXR APIs reproduces these days, and also shows during that period:
- the webgl thread uses the most CPU (a large majority of that time is spent under gl::Finish, which is called from surfman's Device::bind_surface_to_context)
- the main thread is the second-busiest, with the highest usage spent in eglCreatePbufferFromClientBuffer and almost as much time spent grabbing the Egl object from TLS
- webrender's rendering also appears in this stack
- winrt::servo::flush appears in here as well, and it's not clear to me if we actually need to swap the main application's GL buffers while we're in immersive mode
- third highest CPU usage is the script thread, spending lots of time inside JIT code
- after that thread CPU usage is generally pretty low, but there are some symbols from the style crate showing up indicating that layout is occurring
jdm
on 3 Jan 2020
Given those data points, I'm going to try two approaches to start:
- start the next XR frame as soon as possible after waiting for the device frame
- reduce the number of times we need to call gl::Finish (webgl thread), eglCreateBufferFromClientBuffer and TLS (main thread)
jdm
on 3 Jan 2020
https://github.com/servo/servo/pull/25343#issuecomment-567706735 has more investigation into the impact of sending messages to various places in the engine. It doesn't point any clear fingers, but suggests more precise measurements should be taken.
jdm
on 3 Jan 2020
The gl::Finish usage comes from https://github.com/pcwalton/surfman/blob/6705a9aaa8f33ac1324fdb1913242800e68c7720/surfman/src/platform/windows/angle/context.rs#L259-L266.
jdm
on 3 Jan 2020
Changing gl::Finish to gl::Flush boosts the framerate from ~15->30, but there is an extremely noticeable lag in the frame contents actually reflecting the movement of the user's head, causing the current frame to follow the user's head in the meantime.
jdm
on 3 Jan 2020
Keyed mutexes are disabled by default in ANGLE for reasons that elude me, but mozangle explicitly enables them (https://github.com/servo/mozangle/blob/706a9baaf8026c1a3cb6c67ba63aa5f4734264d0/build_data.rs#L175), and that's what surfman gets tested with. I'm going to make a build of ANGLE that enables them and see if that's enough to avoid the gl::Finish calls.
jdm
on 3 Jan 2020
Confirmed! Forcing keyed mutexes on in ANGLE gives me 25-30 FPS in the paint demo without any of the lag issues that came with changing the gl::Finish call.
jdm
on 3 Jan 2020
Oh, and another piece of information according to lars' investigations:
- w/ dom.ion.enabled set to false, JIT time disappears. Initial loads are much slower, but once things are running they're pretty good.
- It's still not fantastic - memory usage is quite high (basically all available memory) on that babylon.js example
- we should do another spidermonkey upgrade to pull in arm64-related optimizations that have been happening for FxR on android devices
jdm
on 3 Jan 2020
I think I misunderstood the presence of std::thread::local::LocalKey<surfman::egll::Egl> in the profiles - I'm pretty sure the TLS read is only a very small part of the time charged to it, and it's the functions called inside the TLS block like eglCreatePbufferFromClientBuffer and DXGIAcquireSync that _actually_ take the time.
jdm
on 3 Jan 2020
Sadly, disabling js.ion.enabled appears to hurt the FPS of the paint demo, taking it down to 20-25.
jdm
on 4 Jan 2020
Rather than calling Device::create_surface_texture_from_texture twice every frame (once for each d3d texture for each eye), it might be possible to create surface textures for all of the swapchain textures when the openxr webxr device is created. If this works, it would remove the second-largest user of CPU from the main thread during immersive mode.
jdm
on 4 Jan 2020
Another idea for reducing memory usage: is there any impact if we set the bfcache to a very low number so the original HL homepage pipeline is evicted when navigating to one of the demos?
jdm
on 4 Jan 2020
The following webxr patch does not clearly improve FPS, but it might improve image stability. I need to create two separate builds that I can run back to back to check.
diff --git a/webxr/openxr/mod.rs b/webxr/openxr/mod.rs
index 91c78da..a6866de 100644
--- a/webxr/openxr/mod.rs
+++ b/webxr/openxr/mod.rs
@@ -416,11 +416,30 @@ impl DeviceAPI<Surface> for OpenXrDevice {
     }

     fn wait_for_animation_frame(&mut self) -> Option<Frame> {
-        if !self.handle_openxr_events() {
-            // Session is not running anymore.
-            return None;
+        loop {
+            if !self.handle_openxr_events() {
+                // Session is not running anymore.
+                return None;
+            }
+            self.frame_state = self.frame_waiter.wait().expect("error waiting for frame");
+
+            // XXXManishearth this code should perhaps be in wait_for_animation_frame,
+            // but we then get errors that wait_image was called without a release_image()
+            self.frame_stream
+                .begin()
+                .expect("failed to start frame stream");
+
+            if self.frame_state.should_render {
+                break;
+            }
+
+            self.frame_stream.end(
+                self.frame_state.predicted_display_time,
+                EnvironmentBlendMode::ADDITIVE,
+                &[],
+            ).unwrap();
         }
-        self.frame_state = self.frame_waiter.wait().expect("error waiting for frame");
+
         let time_ns = time::precise_time_ns();
         // XXXManishearth should we check frame_state.should_render?
         let (_view_flags, views) = self
@@ -506,12 +525,6 @@ impl DeviceAPI<Surface> for OpenXrDevice {
             0,
         );

-        // XXXManishearth this code should perhaps be in wait_for_animation_frame,
-        // but we then get errors that wait_image was called without a release_image()
-        self.frame_stream
-            .begin()
-            .expect("failed to start frame stream");
-
         self.left_image = self.left_swapchain.acquire_image().unwrap();
         self.left_swapchain
             .wait_image(openxr::Duration::INFINITE)
@manishearth any thoughts on this? It's my attempt to get closer to the model described by https://www.khronos.org/registry/OpenXR/specs/1.0/html/xrspec.html#Session.
jdm
on 4 Jan 2020
Yeah, that looks good. I've been meaning to move the begin() up into waf, and i believe the error mentioned in the comment no longer occurs, but it also didn't have a noticeable effect on FPS so I didn't pursue it too much for now. If it improves stability that's good!
 Manishearth
on 4 Jan 2020
Manishearth
on 4 Jan 2020
Really happy about the keyed discovery! Surfman calls indeed take up a bunch of the frame budget but it's a bit hard to determine what is and isn't necessary.
Manishearth
on 4 Jan 2020
Yes, re: disabling js.ion.enabled, that's only going to be a benefit when we're RAM starved and thrashing spending most of our time GC'ing and recompiling functions. And that should be improved with a newer SM. IIRC, the 66-era ARM64 backend also had relatively poor baseline JIT and interpreter performance; we should see speedups across the board with an update but especially on RAM-intensive applications.
 larsbergstrom
on 4 Jan 2020
larsbergstrom
on 4 Jan 2020
Published new ANGLE package with keyed mutexes enabled. I'll create a pull request to upgrade it later.
jdm
on 6 Jan 2020
I tried creating the surface textures for all of the openxr swapchain images during XR device initialization, but there's still a bunch of time on the main thread spent calling eglCreatePbufferFromClientBuffer on the surface that we receive from the webgl thread each frame. Maybe there's some way to cache those surface textures so we can reuse them if we receive the same surface...
jdm
on 6 Jan 2020
The biggest main thread CPU usage comes from render_animation_frame, with most of that under the OpenXR runtime but calls to BlitFramebuffer and FramebufferTexture2D definitely appearing in the profile as well. I wonder if it would be an improvement to blit both eyes at once to a single texture? Maybe that's related to the texture array stuff that's discussed in https://github.com/microsoft/OpenXR-SDK-VisualStudio/#render-with-texture-array-and-vprt.
jdm
on 6 Jan 2020
We can blit both eyes at once, however my understanding is that the runtime
may then do its own blit. The texture array is the fastest method. But
worth a shot, the projection view API supports doing this.
As for the main thread ANGLE traffic, does stopping the RAF loop from
dirtying the canvas help? So far this hasn't done anything but it's worth a
shot, ideally we shouldn't be doing anything layout/rendering on the main
thread.
On Mon, Jan 6, 2020, 11:49 PM Josh Matthews notifications@github.com
wrote:
The biggest main thread CPU usage comes from render_animation_frame, with
most of that under the OpenXR runtime but calls to BlitFramebuffer and
FramebufferTexture2D definitely appearing in the profile as well. I wonder
if it would be an improvement to blit both eyes at once to a single
texture? Maybe that's related to the texture array stuff that's discussed
in
https://github.com/microsoft/OpenXR-SDK-VisualStudio/#render-with-texture-array-and-vprt
.—
You are receiving this because you were mentioned.
Reply to this email directly, view it on GitHub
https://github.com/servo/servo/issues/25425?email_source=notifications&email_token=AAMK6SBRH72JGZMXTUKOXETQ4NY37A5CNFSM4KCRI6AKYY3PNVWWK3TUL52HS4DFVREXG43VMVBW63LNMVXHJKTDN5WW2ZLOORPWSZGOEIGJMHA#issuecomment-571250204,
or unsubscribe
https://github.com/notifications/unsubscribe-auth/AAMK6SECM6MDNZZ6Y7VL7SDQ4NY37ANCNFSM4KCRI6AA
.
Manishearth
on 6 Jan 2020
Removing the canvas dirtying only cleans up the profile; it did not appear to lead to a meaningful FPS increase.
jdm
on 6 Jan 2020
I tried creating a cache of surface textures for surfaces from the webgl thread as well as openxr swapchain textures, and while the eglCreatePbufferFromClientBuffer time disappeared completely, I didn't notice any meaningful FPS change.
jdm
on 6 Jan 2020
Some timing information for various operations in the immersive pipeline (all measurements in ms):
Name            min             max             avg
raf queued      0.070833        14.010261       0.576834
<1ms: 393
<2ms: 28
<4ms: 5
<8ms: 1
<16ms: 2
<32ms: 0
32+ms: 0

raf transmitted 0.404270        33.649583       7.403302
<1ms: 123
<2ms: 43
<4ms: 48
<8ms: 48
<16ms: 95
<32ms: 69
32+ms: 3

raf wait        1.203500        191.064100      17.513593
<1ms: 0
<2ms: 17
<4ms: 98
<8ms: 95
<16ms: 48
<32ms: 69
32+ms: 101

raf execute     3.375000        128.663200      6.994588
<1ms: 0
<2ms: 0
<4ms: 5
<8ms: 351
<16ms: 70
<32ms: 1
32+ms: 2

raf receive     0.111510        8.564010        0.783503
<1ms: 353
<2ms: 52
<4ms: 18
<8ms: 4
<16ms: 1
<32ms: 0
32+ms: 0

raf render      2.372200        75.944000       4.219310
<1ms: 0
<2ms: 0
<4ms: 253
<8ms: 167
<16ms: 8
<32ms: 0
32+ms: 1
receive: time from the XR frame information being sent from the XR thread to being received by the IPC router
queued: time from the IPC router receiving the frame information until XRSession::raf_callback is invoked
execute: time from XRSession::raf_callback invoked until returning from the method
transmitted: time from sending the request for a new rAF from the script thread until received by the XR thread
render: time taken to call render_animation_frame and recycle the surface
wait: time taken by wait_for_animation_frame (using the patch from earlier in this issue that loops over frames that shouldn't render)
Under each entry is the distribution of the values over the course of the session.
jdm
on 7 Jan 2020
An interesting data point from that timing information - the transmitted category seems way higher than it should be. That's the delay between the rAF callback executing and the XR thread receiving the message that blits the completed frame into openxr's texture. There's quite a bit of variation, suggesting that either the main thread is occupied doing other things, or it needs to be woken up in order to process it.
jdm
on 7 Jan 2020
Given the previous data, I may try to resurrect https://github.com/servo/webxr/issues/113 tomorrow to see if that positively affects the transmit timing. I may poke at the main thread in the profiler first to see if I can come up with any ideas about how to tell if the thread is busy with other tasks or asleep.
jdm
on 7 Jan 2020
One other data point:
swap buffer     1.105938        28.193698       2.154793
<1ms: 0
<2ms: 273
<4ms: 110
<8ms: 15
<16ms: 2
<32ms: 2
32+ms: 0

swap complete   0.053802        4.337812        0.295064
<1ms: 308
<2ms: 9
<4ms: 6
<8ms: 1
<16ms: 0
<32ms: 0
32+ms: 0

swap request    0.003333        24033027.355364 4662890.724805
<1ms: 268
<2ms: 49
<4ms: 5
<8ms: 0
<16ms: 0
<32ms: 1
32+ms: 79
These are timings related to 1) the delay from sending the swap buffer message until it's processed in the webgl thread, 2) the time taken to swap the buffers, 3) the delay from sending the message indicating that swapping is complete until it's received in the script thread. Nothing super surprising here (except those weird outliers in the swap request category, but those happen at the very start of the immersive session during setup afaict), but the actual buffer swapping consistently takes between 1-4ms.
jdm
on 7 Jan 2020
Filed #117 after reading through some openxr sample code and noticing that the locate_views calls show up in the profile.
jdm
on 7 Jan 2020
Presumably https://github.com/servo/webxr/issues/117
 asajeffrey
on 7 Jan 2020
asajeffrey
on 7 Jan 2020
An interesting data point from that timing information - the transmitted category seems way higher than it should be. That's the delay between the rAF callback executing and the XR thread receiving the message that blits the completed frame into openxr's texture. There's quite a bit of variation, suggesting that either the main thread is occupied doing other things, or it needs to be woken up in order to process it.
Re the variations in the transmitted value, it might tie into the timeout used as part of run_one_frame when the session is running on the main-thread(which it is in those measurements, right?), see https://github.com/servo/webxr/blob/c6abf4c60d165ffc978ad2ebd6bcddc3c21698e1/webxr-api/session.rs#L275
I surmise that when the RenderAnimationFrame msg(the one sent by the script-thread after running the callbacks) is received before the timeout, you hit the "fast path", and if the timeout is missed Servo goes into another iteration of perform_updates, and "running another frame" happens fairly late in the cycle, as part of compositor.perform_updates, itself called fairly late as part of servo.handle_events.
Short of moving XR to it's own thread, it might be worth it seeing if a higher value for the timeout improves the average value(although it might not be the right solution since it might starve other necessary stuff on the main-thread).
 gterzian
on 8 Jan 2020
gterzian
on 8 Jan 2020
I've made progress on getting openxr off the main thread in https://github.com/servo/webxr/issues/113, so I'm going to take more measurements based on that work next week.
jdm
on 10 Jan 2020
Techniques for getting useful profiles from the device:
- use a .servobuild that includes
rustflags = "-C force-frame-pointers=yes" - uncomment these lines
- use WinXR_Perf.wprp from the MS teams char
Filestab as a custom tracing profile under "Performance Tracing" in the HL device portal - build with
--features profilemozjs
These traces (obtained from "Start Trace" in the device portal) will be usable inside the Windows Performance Analyzer tool. This tool doesn't show thread names, but the threads using the most CPU are straightforward to identify based on the stacks.
To profile the time distribution of a particular openxr frame:
- add the "System Activity -> Generic Events" view in WPA
- filter the view to only show the Microsoft.Windows.WinXrContinuousProvider series
- zoom in to a short duration, then refine the zoomed in region so that an xrBegin event is at the left side of the view, and an xrEnd event is at the right side of the view
Most useful views for CPU usage:
- CPU Usage (Sampled) -> Utilization by Process, Thread, Stack (filter the view to show only Servo, then disable the Process column)
- Flame by Process, Stack (filter the view to show only Servo)
jdm
on 16 Jan 2020
One possibility for doing slightly less work in the script thread:
- XRView::new consumes 0.02% of all Servo CPU
- since the contents of the view objects don't change unless there's a FrameUpdateEvent::UpdateViews event (which comes from Session::update_clip_planes via XRSession::UpdateRenderState), we could conceivably cache the XRView objects on the XRSession and keep using them until the render state is updated
- we could even keep the JS representation of the views list cached in XRSession and set the pose's views member, avoiding both recreating the XRView objects, and allocating the vector, and performing the JS value conversion
jdm
on 16 Jan 2020
One possibility for doing less work when rendering an immersive frame:
- GL and d3d have inverted Y coordinate systems
- ANGLE implicitly hides this when presenting to the screen by doing some work behind the scenes
- for immersive mode, we use glBlitFramebuffer to perform a y-inversion when blitting the GL texture data to d3d
- if we can figure out how to make ANGLE not do the conversion internally, it might be possible to invert this model and make rendering non-immersive web pages require an extra y-invert blit (via the webrender option
surface_origin_is_top_left) while immersive mode could be blitted without any transformation
Based on https://bugzilla.mozilla.org/show_bug.cgi?id=1591346 and talking with jrmuizel, here is what we'll need to do:
- obtain a d3d swapchain for the window element we want to render non-immersive pages into (this will be the SwapChainPanel in the XAML app)
- wrap that in an EGL image (https://searchfox.org/mozilla-central/rev/c52d5f8025b5c9b2b4487159419ac9012762c40c/gfx/webrender_bindings/RenderCompositorANGLE.cpp#554)
- explicitly Present the swapchain when we want to update the main rendering
- avoid using eglCreateWindowSurface and eglSwapBuffers in https://github.com/servo/servo/blob/master/support/hololens/ServoApp/ServoControl/OpenGLES.cpp#L205-L208
Relevant Gecko code: https://searchfox.org/mozilla-central/rev/c52d5f8025b5c9b2b4487159419ac9012762c40c/gfx/webrender_bindings/RenderCompositorANGLE.cpp#192
Relevant ANGLE code: https://github.com/google/angle/blob/df0203a9ae7a285d885d7bc5c2d4754fe8a59c72/src/libANGLE/renderer/d3d/d3d11/winrt/SwapChainPanelNativeWindow.cpp#L244
jdm
on 16 Jan 2020
Current wip branches:
- https://github.com/servo/ipc-channel/tree/try-recv-error
- https://github.com/jdm/webxr/tree/oxr
- https://github.com/jdm/rust-offscreen-rendering-context/tree/angle-perf
- https://github.com/jdm/servo/tree/profile
This includes a xr-profile feature that adds the timing data I mentioned earlier, as well as an initial implementation of the ANGLE changes to remove the y-inverse transformation in immersive mode. The non-immersive mode is rendering correctly, but immersive mode is upside down. I believe I need to remove the GL code from render_animation_frame and replace it with a direct CopySubresourceRegion call by extracting the share handle from the GL surface so I can get its d3d texture.
jdm
on 17 Jan 2020
Filed https://github.com/servo/servo/issues/25582 for the ANGLE y-inversion work; further updates on that work will take place in that issue.
jdm
on 23 Jan 2020
The next big ticket item will be investigating ways of avoiding the glBlitFramebuffer calls in the openxr webxr backend entirely. This necessitates:
- creating openxr framebuffers that match the required opaque webgl framebuffers precisely
- supporting a webgl mode where the webxr backend provides all of the swapchain surfaces, rather than creating them (eg. in https://github.com/asajeffrey/surfman-chains/blob/27a7ab8fec73f19f0c4252ff7ab52e84609e1fa5/surfman-chains/lib.rs#L458 and https://github.com/asajeffrey/surfman-chains/blob/27a7ab8fec73f19f0c4252ff7ab52e84609e1fa5/surfman-chains/lib.rs#L111-L118)
jdm
on 23 Jan 2020
That may be difficult, as surfman only provides write access to the context that created the surface, so if the surface is created by the openxr thread, it won't be writeable by the WebGL thread. https://github.com/pcwalton/surfman/blob/a515fb2f5d6b9e9b36ba4e8b498cdb4bea92d330/surfman/src/device.rs#L95-L96
asajeffrey
on 23 Jan 2020
It occurs to me - if we did the openxr rendering in the webgl thread, a bunch of the threading-related issues around rendering directly to openxr's textures would no longer be issues (ie. the restrictions around eglCreatePbufferFromClientBuffer prohibiting using multiple d3d devices). Consider:
- there's still an openxr thread that is responsible for polling for openxr events, waiting for an animation frame, beginning a new frame and retrieving the current frame state
- the frame state is sent to the script thread, which performs the animation callback then sends a message to the webgl thread to swap the xr layer's framebuffer
- when this swap message is received in the webgl thread, we release the last acquired openxr swapchain image, send a message to the openxr thread to end the current frame, and acquire a new swapchain image for the next frame
My reading of https://www.khronos.org/registry/OpenXR/specs/1.0/html/xrspec.html#threading-behavior suggests that this design might be workable. The trick is whether it can work for our non-openxr backends as well as for openxr.
From the spec: "While xrBeginFrame and xrEndFrame do not need to be called on the same thread, the application must handle synchronization if they are called on separate threads."
jdm
on 25 Jan 2020
At the moment there's no direct communication between the XR device threads and webgl, it all either goes via script or via their shared swap chain. I'd be tempted to provide a swap-chain API that sits above either a surfman swap chain or an openxr swap chain, and use that for webgl-to-openxr communication.
asajeffrey
on 25 Jan 2020
Notes from a conversation about the earlier time measurements:
* concerns about wait time - why?????
* figure out time spent in JS vs. DOM logic
* when does openxr give us should render=false frames - maybe related to previous frame taking too long
* are threads being scheduled on inappropriate cpus? - on magic leap, main thread (including weber) pinned to big core.
* when one of the measured numbers is large, is there correlation with other large numbers?
* probably should pin openxr thread, running deterministic code
* consider clearing after telling script that the swap is complete - measure if clear is taking significant time in swap operation
* consider a swap chain API operation - “wait until a buffer swap occurs”
  - block waiting on swapchain
  - block waiting on swapchain + timeout
  - async????????
- a gc would look like a spike in script execution time
Filed #25735 to track the investigations I'm pursuing about rendering directly to the openxr textures.
jdm
on 11 Feb 2020
One thing we should do is narrow down how spidermonkey compares on the device to other engines. The easiest way to get some data here is to find a simple JS benchmark that Servo can run, and compare Servo's performance to the Edge browser installed on the device. Additionally, we could try visiting some complex babylon demos in both browsers without entering immersive mode to see if there's a significant performance difference. This will also give us a benchmark to compare against the forthcoming spidermonkey upgrade.
jdm
on 13 Feb 2020
Some new data. This is with the ANGLE upgrade, but not the IPC one.
$ python timing.py raw
Name        min     max     mean
raf queued  0.056198    5.673125    0.694902
<1ms: 335
<2ms: 26
<4ms: 17
<8ms: 7
<16ms: 0
<32ms: 0
32+ms: 0

raf transmitted 0.822917    36.582083   7.658619
<1ms: 1
<2ms: 4
<4ms: 31
<8ms: 181
<16ms: 158
<32ms: 8
32+ms: 1

raf wait    1.196615    39.707709   10.256875
<1ms: 0
<2ms: 32
<4ms: 93
<8ms: 67
<16ms: 107
<32ms: 68
32+ms: 17

raf execute 3.078438    532.205677  7.752839
<1ms: 0
<2ms: 0
<4ms: 37
<8ms: 290
<16ms: 52
<32ms: 2
32+ms: 3

raf receive 0.084375    9.053125    1.024403
<1ms: 276
<2ms: 71
<4ms: 27
<8ms: 9
<16ms: 1
<32ms: 0
32+ms: 0

swap request    0.004115    73.939479   0.611254
<1ms: 369
<2ms: 10
<4ms: 5
<8ms: 0
<16ms: 0
<32ms: 0
32+ms: 2

raf render  5.706198    233.459636  9.241698
<1ms: 0
<2ms: 0
<4ms: 0
<8ms: 183
<16ms: 190
<32ms: 10
32+ms: 1

run_one_frame   7.663333    2631.052969 28.035143
<1ms: 0
<2ms: 0
<4ms: 0
<8ms: 3
<16ms: 157
<32ms: 185
32+ms: 41

swap buffer 0.611927    8.521302    1.580279
<1ms: 127
<2ms: 169
<4ms: 74
<8ms: 15
<16ms: 1
<32ms: 0
32+ms: 0

swap complete   0.046511    2.446302    0.215040
<1ms: 375
<2ms: 6
<4ms: 3
<8ms: 0
<16ms: 0
<32ms: 0
32+ms: 0
Timing data: https://gist.github.com/Manishearth/825799a98bf4dca0d9a7e55058574736
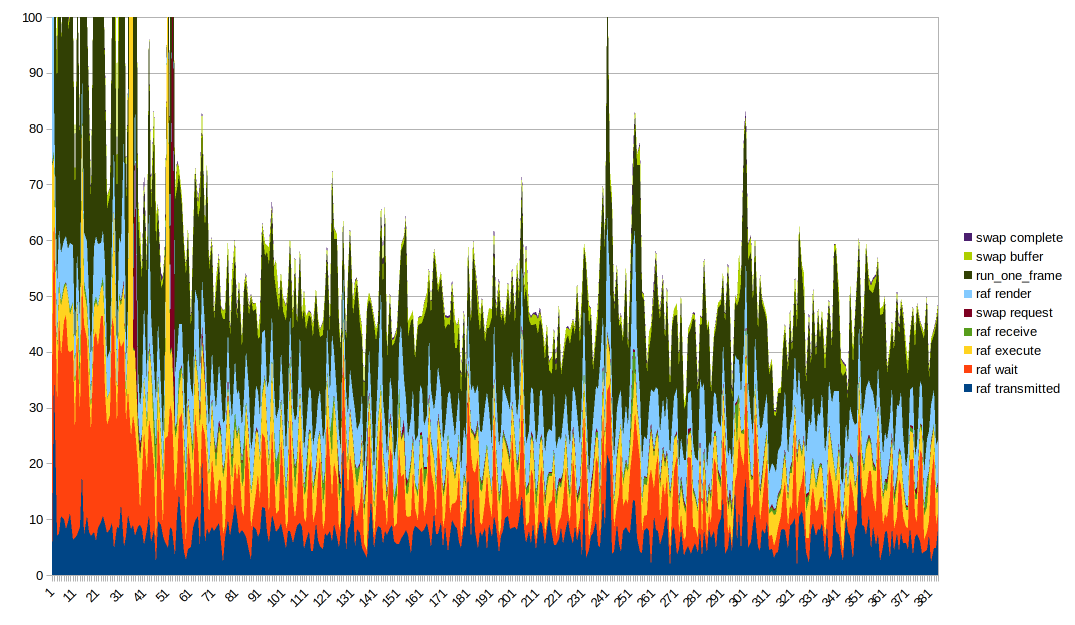
Getting good data visualization of this is tricky. A stacked line graph seems ideal, though it's worth noting that run_one_frame measures multiple already-measured timings. It's helpful to fiddle with the graph ordering and put different columns on the bottom to better see their effect. Also you need to truncate the Y axis to get anything useful due to some very large outliers.
Interesting things to note:
- render time and execute time seem to be mostly steady but have spikes when there are large spikes overall. I suspect the large spikes come from just everything slowing down for whatever reason
- The transmit time seems pretty well correlated with the overall shape
- wait time is also part of the reason the overall shape is like that, it's _very_ wavy
Manishearth
on 21 Feb 2020
Current status: with IPC fixes, FPS is now hovering around 55. It sometimes wiggles a bunch, but usually doesn't go below 45, _except_ during the first few seconds after load (where it can go down to 30), and when it first sees a hand (when it goes down to 20).
Manishearth
on 25 Feb 2020
Newer histogram for paint demo (raw data):
Name        min     max     mean
raf queued  0.113854    5.707917    0.441650
<1ms: 352
<2ms: 13
<4ms: 5
<8ms: 1
<16ms: 0
<32ms: 0
32+ms: 0

raf transmitted 0.546667    44.954792   6.886162
<1ms: 4
<2ms: 2
<4ms: 23
<8ms: 279
<16ms: 59
<32ms: 3
32+ms: 1

raf wait    1.611667    37.913177   9.441104
<1ms: 0
<2ms: 6
<4ms: 98
<8ms: 82
<16ms: 135
<32ms: 43
32+ms: 6

raf execute 3.336562    418.198541  7.592147
<1ms: 0
<2ms: 0
<4ms: 11
<8ms: 319
<16ms: 36
<32ms: 2
32+ms: 3

raf receive 0.119323    9.804167    0.806074
<1ms: 324
<2ms: 31
<4ms: 13
<8ms: 1
<16ms: 1
<32ms: 0
32+ms: 0

swap request    0.003646    79.236354   0.761324
<1ms: 357
<2ms: 9
<4ms: 2
<8ms: 0
<16ms: 0
<32ms: 0
32+ms: 3

raf render  5.844687    172.898906  8.131682
<1ms: 0
<2ms: 0
<4ms: 0
<8ms: 283
<16ms: 86
<32ms: 1
32+ms: 1

run_one_frame   8.826198    2577.357604 25.922205
<1ms: 0
<2ms: 0
<4ms: 0
<8ms: 0
<16ms: 176
<32ms: 174
32+ms: 22

swap buffer 0.708177    12.528906   1.415950
<1ms: 164
<2ms: 161
<4ms: 38
<8ms: 4
<16ms: 4
<32ms: 0
32+ms: 0

swap complete   0.042917    1.554740    0.127729
<1ms: 370
<2ms: 1
<4ms: 0
<8ms: 0
<16ms: 0
<32ms: 0
32+ms: 0
Longer run (raw). Made to reduce the impact of startup slowdowns.
Name min max mean
raf queued 0.124896 6.356562 0.440674
<1ms: 629
<2ms: 13
<4ms: 5
<8ms: 1
<16ms: 0
<32ms: 0
32+ms: 0
raf transmitted 0.640677 20.275104 6.944751
<1ms: 2
<2ms: 3
<4ms: 29
<8ms: 513
<16ms: 99
<32ms: 1
32+ms: 0
raf wait 1.645886 40.955208 9.386255
<1ms: 0
<2ms: 10
<4ms: 207
<8ms: 114
<16ms: 236
<32ms: 65
32+ms: 15
raf execute 3.090104 526.041198 6.226997
<1ms: 0
<2ms: 0
<4ms: 68
<8ms: 546
<16ms: 29
<32ms: 1
32+ms: 3
raf receive 0.203334 6.441198 0.747615
<1ms: 554
<2ms: 84
<4ms: 7
<8ms: 2
<16ms: 0
<32ms: 0
32+ms: 0
swap request 0.003490 73.644322 0.428460
<1ms: 627
<2ms: 18
<4ms: 1
<8ms: 0
<16ms: 0
<32ms: 0
32+ms: 2
raf render 5.450312 209.662969 8.055021
<1ms: 0
<2ms: 0
<4ms: 0
<8ms: 467
<16ms: 176
<32ms: 3
32+ms: 1
run_one_frame 8.417291 2579.454948 22.226204
<1ms: 0
<2ms: 0
<4ms: 0
<8ms: 0
<16ms: 326
<32ms: 290
32+ms: 33
swap buffer 0.658125 12.179167 1.378725
<1ms: 260
<2ms: 308
<4ms: 72
<8ms: 4
<16ms: 4
<32ms: 0
32+ms: 0
swap complete 0.041562 5.161458 0.136875
<1ms: 642
<2ms: 3
<4ms: 1
<8ms: 1
<16ms: 0
<32ms: 0
32+ms: 0
Manishearth
on 27 Feb 2020
Graphs:
Longer run:

Shorter run:
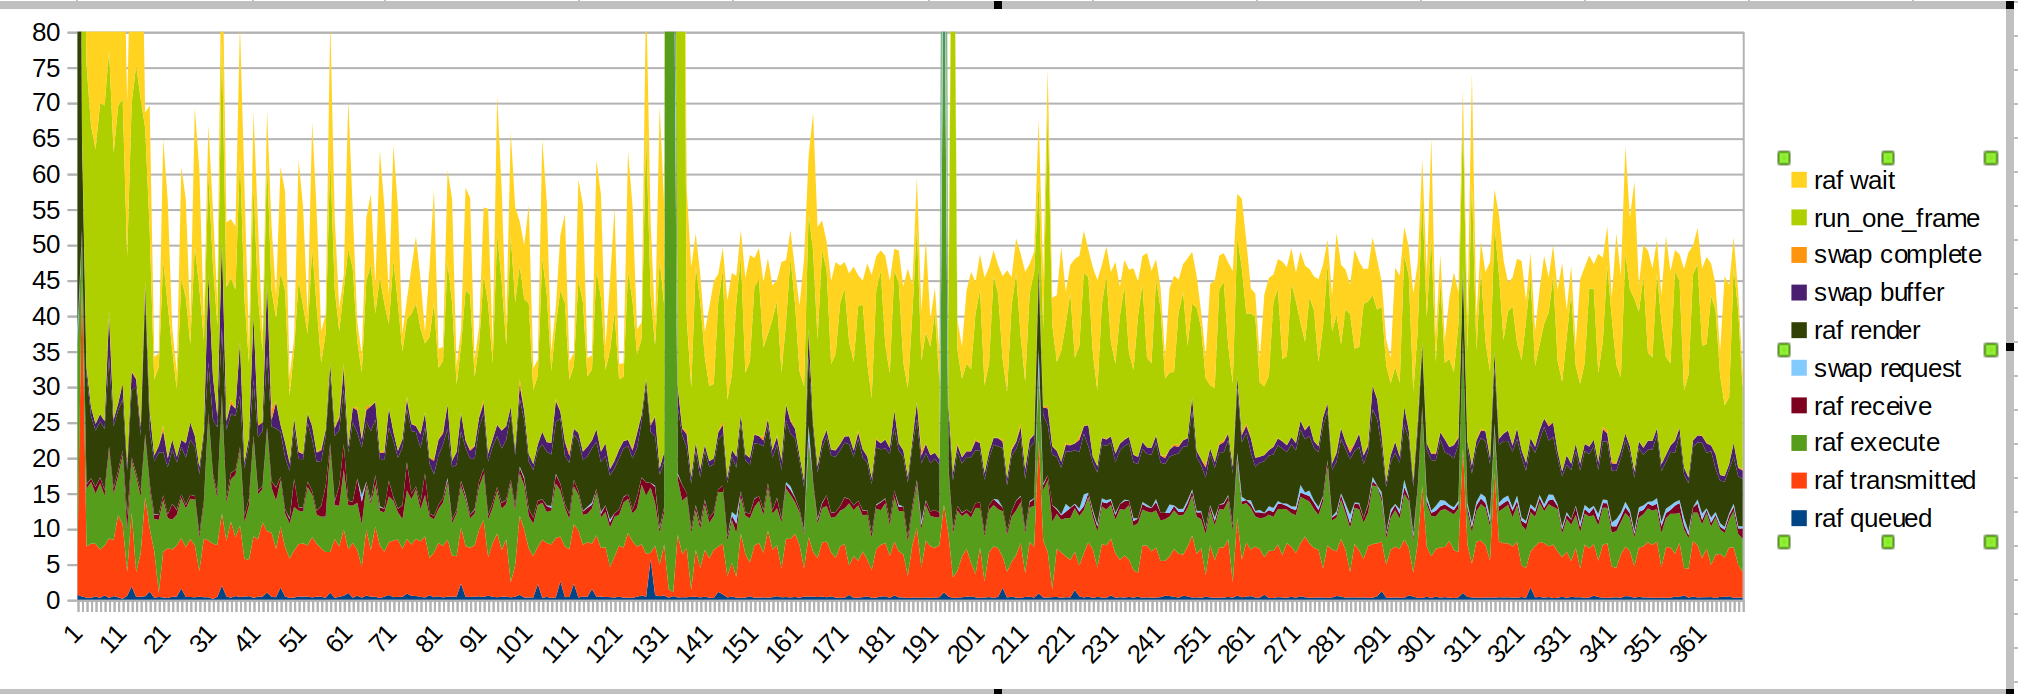
the big spike is when I put my hand within sensor range.
This time I put the wait/run_one_frame times up top because those are the most jagged, and that's because of the OS throttling us.
Couple things to note:
- The big spike from hands being introduced is caused by JS code (basil green, "raf render")
- transmission time has gotten smoother, as expected
- when I start drawing there is another JS spike
- render and transmission time are still significant chunks of budget. Script performance could also be improved.
- I suspect the transmission time takes so long because of the main thread being busy doing other things. This is https://github.com/servo/webxr/issues/113 , @jdm is looking into it
- surfman updates may improve render times. @asajeffrey 's measurements on surfmanup seem better than mine
- doing the surface sharing may improve render times (blocked on surfmanup)
- the FPS shown by the device is almost halved when measuring it with xr-profile. This might be because of all the IO.
The performance kinks because of seeing the hand and then starting to draw are not present for ballshooter. Perhaps the paint demo is doing a lot of work when it first decides to draw the hand image?
(This could also be the paint demo attempting to interact with the webxr inputs library)
Manishearth
on 27 Feb 2020
@Manishearth Can you also overlay memory usage & correlate to those events? In addition to JS code first-time compilation, you may be faulting in a ton of new code and running up against physical memory limits and incurring a bunch of GCs as you hit memory pressure. I was seeing that in most non-trivial situations. I'm hopeful that @nox's SM update will help, as that was definitely an artifact we saw in this SM build on FxR Android.
larsbergstrom
on 27 Feb 2020
I don't have an easy way of getting memory profiling data in a way that can be correlalted with the xr-profiling stuff.
I could potentially use the existing perf tools and figure out if the shape is the same.
Manishearth
on 27 Feb 2020
@Manishearth Does the xr-profiling stuff show (or could it show) JS GC events? That might be a reasonable proxy.
larsbergstrom
on 27 Feb 2020
Either way, startup spikes aren't my primary concern, I'd like to get everything _else_ at 60fps first. If it's janky for a second or two at startup that's a less pressing concern.
Manishearth
on 27 Feb 2020
Yes, it could show that, would need some tweaks.
Manishearth
on 27 Feb 2020
@Manishearth Totally agreed on the priorities! I wasn't sure if you were trying to "unkink the kinks" or drive down steady-state. Agree latter more important right now.
larsbergstrom
on 27 Feb 2020
Nah, I was mostly just noting down all the analysis I could.
Manishearth
on 27 Feb 2020
Those spikes near the end of the graph of the smaller run where transmission time spikes as well: That's when I was moving my head and drawing, and Alan was also noticing drops in FPS when doing things, and attributed it to the OS doing other work. After the IPC fixes my hunch on transmission time spikes is that they're caused by the OS doing other work, so that might be what's going on there. In an off-main-thread world I'd expect it to be much smoother.
Manishearth
on 27 Feb 2020
Ignore me if this was considered already, have you thought of breaking down the measurement of run_one_frame on a per-message-handled basis, and also timing the time spent thread::sleep()-ing?
It might be worth adding three measurement points:
one wrapping https://github.com/servo/webxr/blob/68b024221b8c72b5b33a63441d63803a13eadf03/webxr-api/session.rs#L364
and another wrapping https://github.com/servo/webxr/blob/2841497966d87bbd561f18ea66547dde9b13962f/webxr-api/lib.rs#L124 as a whole,
and also one wrapping the call to
thread::sleeponly.
As to the recv_timeout, this could be something to reconsider entirely.
I find it somewhat hard to reason about the usefulness of the timeout. Since you're counting frame rendered, see the frame_count, the usecase would seem to be "perhaps handle one or several message that aren't rendering the frame, first, followed by rendering a frame, while avoiding going through the full event-loop of the main-thread"?
Also I have some doubts about the actual calcuation of the delay used in it, where currently:
- it starts at
delay = timeout / 1000, withtimeoutbeing currently set a 5 ms - It then grows exponentially, doubling at each iteration at
delay = delay * 2; - It's checked at the top of the loop with
while delay < timeout.
So the sequence of sleeps, in the worst case, goes something like: 5micro -> 10 -> 20 -> 40 -> 80 -> 160 -> 320 -> 640 -> 1.28milli -> 2.56 milli -> 5.12 milli
When it hits 5.12 millisecond, you'll break out of the loop(since delay > timeout), having waited a total of 5,115 milli seconds, plus whatever additional time spent waiting on the OS waking up the thread after each sleep.
So I think the problem is you might be sleeping for more than 5ms in total, and also I think it's not a good idea to sleep twice for more than 1 ms(and of which the second time is more than 2.5 ms) since a message could come in during that time and you won't wake-up.
I'm not quite sure how to improve it, it sounds like you're trying to spin for a potential message, and finally just move on to the next iteration of the main event-loop if nothing is available(why not block on the recv?).
You could switch to use https://doc.rust-lang.org/std/thread/fn.yield_now.html, looking at this article on locks, it seems spinning about 40 times while calling yield each time, is optimal(see the "Spinning" paragraph, can't link directly to it). After that you should either block on the receiver, or just continue with the current iteration of the event-loop(since this is running like a sub-loop inside the main embedding event-loop).
(obviously, if you're not measuring with ipc turned on, the part above on recv_timeout is irrelevant, although you might still want to measure the calll to recv_timeout on the mpsc since the threaded channel will do some internal spinning/yielding which might also influence results. And since an unidentified "IPC fix" has been mentioned on several occasion above, I'm assume you are measuring with ipc).
gterzian
on 27 Feb 2020
Ignore me if this was considered already, have you thought of breaking down the measurement of run_one_frame on a per-message-handled basis, and also timing the time spent thread::sleep()-ing?
It's already broken down, the wait/render times are precisely this. A single tick of run_one_frame is one render, one wait, and an indeterminate number of events being handled (rare).
recv_timeout is a good idea for measurement
Manishearth
on 27 Feb 2020
Sadly, the spidermonkey upgrade in #25678 does not appear to be a significant improvement - the average FPS of every demo except the most memory constrained decreased; the Hill Valley demo went up slightly. Running Servo with -Z gc-profile in the initialization arguments doesn't show any difference in GC behaviour between master and the spidermonkey upgrade branch - no GCs are reported after the GL content has been loaded and displayed.
jdm
on 3 Mar 2020
Measurements for various branches:
master:
- espilit: 14-16 fps
- paint: 39-45 fps
- ball shooter: 30-40 fps
- hill valley: 8 fps, 200mb free mem
- mansion: 10-14fps, 650mb free mem

master + single swapchain:
- espilit: 10-12 fps
- paint: 29-55 fps, 1.2gb free mem
- ball shooter: 25-35 fps, 1.3gb free mem
- hill valley: 6-7 fps, 200mb free mem
- mansion: 10-11 fps, 700mb free mem

texture sharing + ANGLE 2.1.19:
- espilit: 13-15 fps, 670mb free mem
- paint: 39-45 fps
- ball shooter: 30-37 fps, 1.3gb free mem
- hill valley: 9-10 fps, 188mb free mem
- mansion: 13-14 fps, 671mb free mem

smup:
- espilit: 11-13 fps, 730mb free mem
- paint: 25-42 fps, 1.1gb free mem
- ball shooter: 26-30 fps, 1.4gb free mem
- hill valley: 10-11 fps, 145mb
- mansion: 9-11fps, 680mb free mem
The smup made performance worse???
asajeffrey
on 3 Mar 2020
With the changes from https://github.com/servo/servo/pull/25855#issuecomment-594203492, there's the interesting result that disabling the Ion JIT starts at 12 FPS, and then several seconds later it abruptly tanks to 1 FPS and stays there.
jdm
on 3 Mar 2020
Did some measurements with those patches.
On paint, I'm getting 60fps when there's not much content in view, and when looking at drawn content it drops down to 50ish fps (the yellow spikes are when i'm looking at drawn content). It's hard to tell why, mostly it seems like wait time is being affected by openxr throttling but the other things don't seem slow enough to cause a problem. Swap request timing is a little bit slower. rAF execution time is slow initially (this is the initial "first time a controller is seen" slowdown) but after that it's pretty constant. It seems like openxr is just throttling us, but there's no visible slowdown elsewhere that would cause that.

Manishearth
on 7 Mar 2020
This is what I have for the dragging demo. The y-scale is the same. Here it's much more obvious that execution time is slowing us down.

Manishearth
on 7 Mar 2020
One thing to note is that I was taking measurements with #25837 applied, and it could affect the performance.
jdm
on 7 Mar 2020
I was not, however I was getting similar results to you
Manishearth
on 7 Mar 2020
Performance tool graphs for the moment where it goes from 60FPS to 45FPS when looking at content:
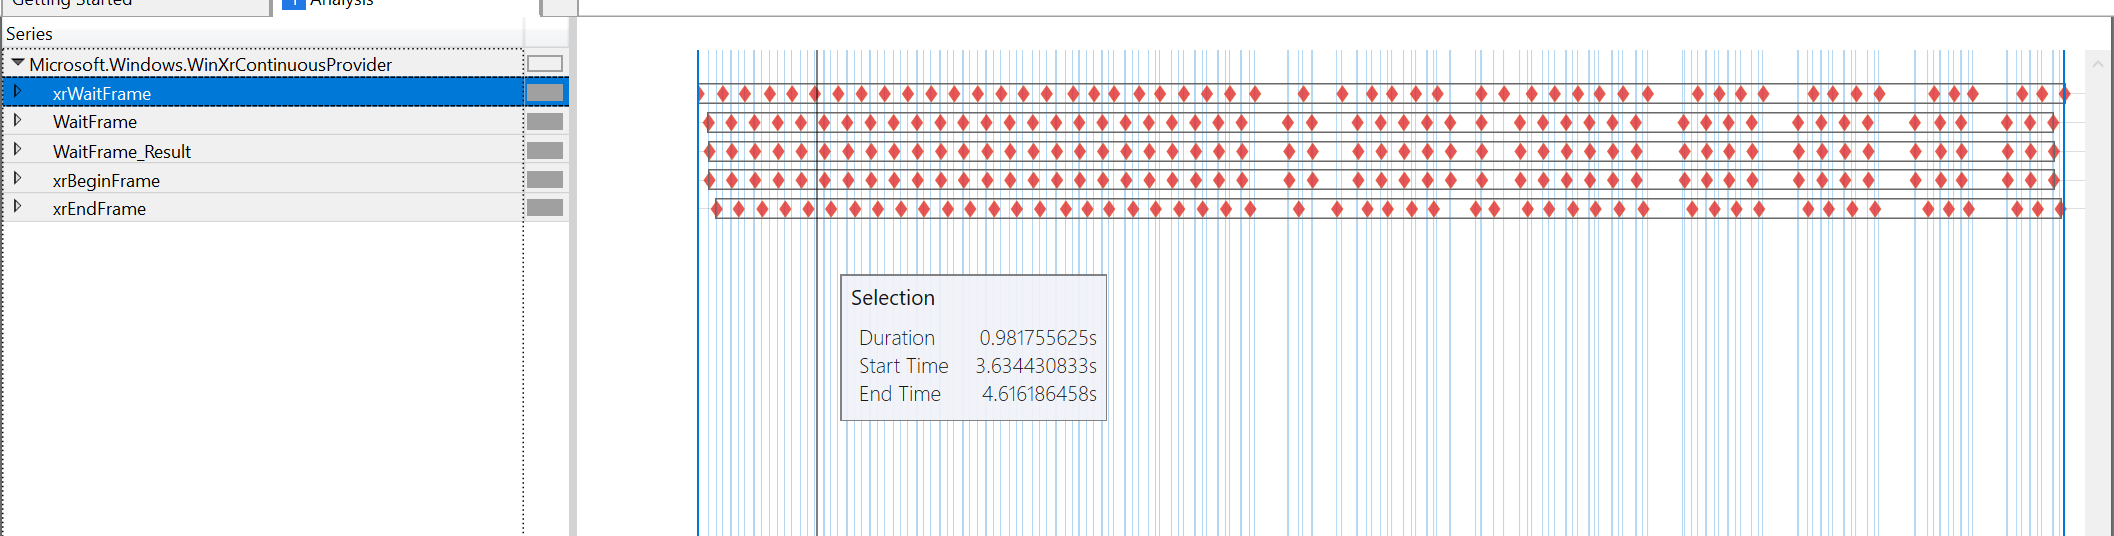
it seems like the blame is entirely on xrWaitFrame, all the other timings are quite close together. The xrBeginFrame is still almost immediately after xrWaitFrame, the xrEndFrame is 4us after the xrBeginFrame (in both cases). The next xrWaitFrame is almost immediately after the xrEndFrame. The only unaccounted for gap is the one caused by xrWaitFrame itself.
Manishearth
on 11 Mar 2020
With the dragging demo, I get the following trace:

This is the paint demo with the same scale:
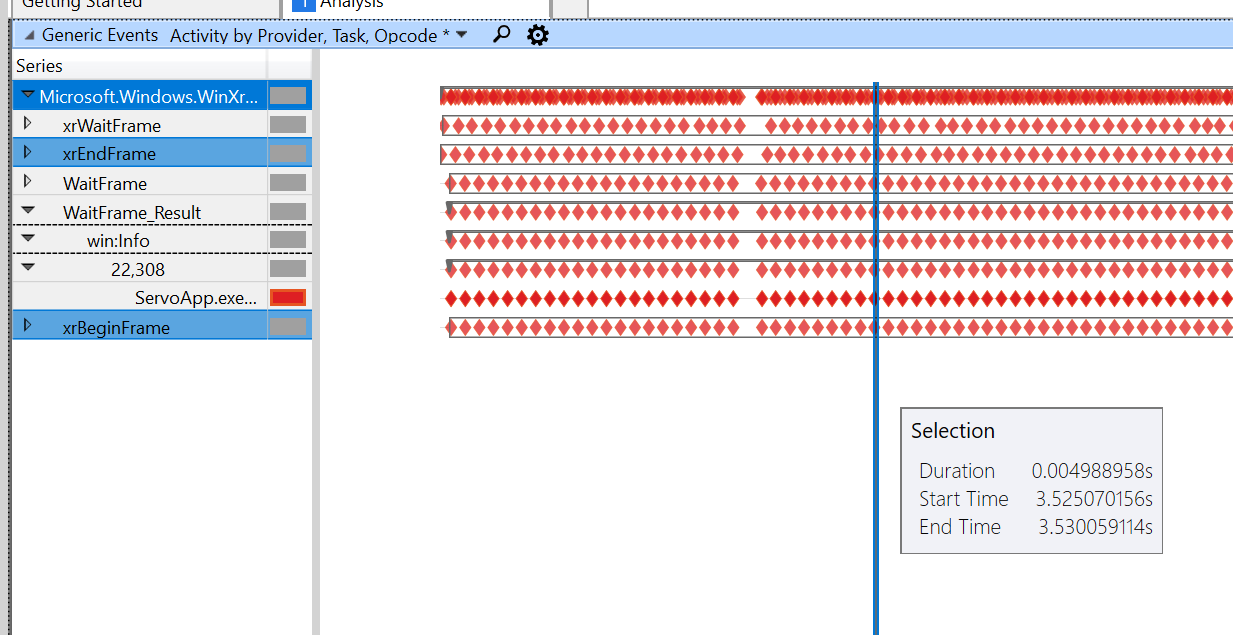
We're slow between begin/end frame (from 5ms to 38ms on the fastest!), and then the wait frame throttling kicks in. I haven't yet teased out why this is the case, I'm going through the code for both.
Manishearth
on 18 Mar 2020
The dragging demo is slowed down because its light source casts a shadow. The shadow stuff is done on the GL side so I'm not sure if we can speed that up easily?
Manishearth
on 18 Mar 2020
If it's done entirely through GLSL we may have difficulties; if it's done every frame through WebGL APIs then there may be places to optimize.
jdm
on 18 Mar 2020
Yeah it seems to all be on the GLSL side; I couldn't see any WebGL calls when it comes to how the shadow APIs work, just some bits that get passed down to shaders
Manishearth
on 19 Mar 2020
I believe this has been addressed in general. We can file issues for individual demos that need work.
jdm
on 20 Jul 2020
Related issues
 pyfisch
·
4Comments
pyfisch
·
4Comments
 CYBAI
·
3Comments
CYBAI
·
3Comments
 pshaughn
·
3Comments
gterzian
·
3Comments
pshaughn
·
3Comments
gterzian
·
3Comments
 shinglyu
·
4Comments
shinglyu
·
4Comments
Most helpful comment
Current status: with IPC fixes, FPS is now hovering around 55. It sometimes wiggles a bunch, but usually doesn't go below 45, _except_ during the first few seconds after load (where it can go down to 30), and when it first sees a hand (when it goes down to 20).