我使用已发布的 1.2.1 版进行开发,因为它易于在 python 中安装,我还使用 c_api 编写了一个简单的 c 代码进行预测。 如果链接到 v1.2.1 libxgboost.so,python 和 c 之间的预测差异恰好为零。 但是,如果从 master 分支链接到 libxgboost.so(在 2020 年 11 月 5 日提交 f3a425398),则存在差异。
我想使用master分支在真实系统中部署c代码,因为我想构建一个静态库,现在v1.2.1和master分支之间的预测差异阻碍了我。
谢谢。
 7starsea
所有35条评论
您可以发布一个示例程序以便我们可以重现该错误吗?
 hcho3
于 2020-11-06
hcho3
于 2020-11-06
另外,您是否看到与 Python 包和 C API 的主版本不同的预测?
hcho3
于 2020-11-06
对 CPU 预测器进行了一些优化,可能会因不同的浮点错误而产生不同的结果。 但是,是的,您有可重复的示例吗?
 trivialfis
于 2020-11-06
trivialfis
于 2020-11-06
另外,您是否看到与 Python 包和 C API 的主版本不同的预测?
我正在比较python包的v1.2.1和C API的master分支。
7starsea
于 2020-11-06
@7starsea你还能比较来自主分支的 Python 和 C API 的输出吗? 问题可能是在您的应用程序中使用 C API 函数的方式。
hcho3
于 2020-11-06
@7starsea你还能比较来自主分支的 Python 和 C API 的输出吗? 问题可能是在您的应用程序中使用 C API 函数的方式。
我比较了python和c api,都来自v1.2.1,预测完全一样。
7starsea
于 2020-11-06
@7starsea 明白了。 如果您发布从同一模型预测的 Python 和 C 程序,我们将能够进一步解决问题。
hcho3
于 2020-11-06
@hcho3这里是测试代码
7starsea
于 2020-11-06
@7starsea我刚刚试过你的例子并得到以下输出:
difference: [0. 0. 0. 0.] 0.0 0.0
我使用了 XGBoost 的最新提交(debeae2509d90ec1d3402a3a185fba7a25113ff1)。
hcho3
于 2020-11-12
@7starsea我刚刚试过你的例子并得到以下输出:
difference: [0. 0. 0. 0.] 0.0 0.0我使用了 XGBoost ( debeae2 ) 的最新提交。
有意思,你的python版本是v1.2.1吗?
我在 python 版本 1.2.1 和链接到 XGBoost ( debeae2 ) 的 c api 之间仍然有一些区别。
7starsea
于 2020-11-12
@7starsea不,我从最新的源代码(commit debeae2509d90ec1d3402a3a185fba7a25113ff1)编译了 XGBoost,所以它比 v1.2.1 更新。 我的 XGBoost Python 包为xgboost.__version__字段打印1.3.0-SNAPSHOT 。
hcho3
于 2020-11-12
@hcho3我想知道 XGBoost 是否应该在不同版本(至少是连续版本)之间保持一致的预测?
同样期待 v1.3.0 的发布。
(似乎我现在需要使用 master 分支来训练模型)
谢谢你的时间。
7starsea
于 2020-11-12
@7starsea如果您从以前的版本加载保存的模型,您应该能够获得一致的预测。
我无法使用您的脚本重现该问题。 您可以尝试构建 Docker 映像或 VM 映像并与我共享吗?
hcho3
于 2020-11-12
@7starsea仅供参考,我也尝试从源代码构建 XGBoost 1.2.1,如下所示:
git clone --recursive https://github.com/dmlc/xgboost -b release_1.2.0 xgb_source
cd xgb_source
mkdir build
cd build
cmake ..
make
cd ../python-package
python setup.py install
结果再次显示difference: [0. 0. 0. 0.] 0.0 0.0
hcho3
于 2020-11-12
要查看差异,您需要两个版本的 XGBoost,用于 Python 的 v1.2.1 和
dtest = xgb.DMatrix(rx, missing=0.0)
y1 = m2.predict(dtest) # # internally using libxgboost.so v1.2.1
一个用于 cpp
m1 = XgbShannonPredictor(fname)
y2 = m1.predict(rx2) # # internally using libxgboost.so from the master branch (debeae2)
我将尝试构建一个 docker 镜像(这对我来说是新的)。
7starsea
于 2020-11-12
让我看一看。
trivialfis
于 2020-11-12
我将尝试构建一个 docker 镜像(这对我来说是新的)。
不必要。
trivialfis
于 2020-11-12
实际上,我设法重现了这个问题。 事实证明,XGBoost 的开发版本产生的预测与 XGBoost 1.2.0 不同。 并且问题很容易重现; 无需使用 C API。
可重现的示例(编辑:设置随机种子):
import numpy as np
import xgboost as xgb
rng = np.random.default_rng(seed=2020)
rx = rng.standard_normal(size=(100, 127 + 7 + 1))
rx = rx.astype(np.float32, order='C')
m2 = xgb.Booster({'nthread': '4'}) # init model
m2.load_model('xgb.model.bin') # load data
dtest = xgb.DMatrix(rx, missing=0.0)
y1 = m2.predict(dtest)
print(xgb.__version__)
print(y1)
1.2.0 的输出:
1.2.0
[ 0.00698659 -0.00211251 0.00180039 -0.00016004 0.00526169 0.00801963
0.00016755 0.00226218 0.00276762 0.00408182 0.00303206 0.00291929
0.01101092 0.0068329 0.00145864 0.00326979 0.00572816 0.01019934
0.00074345 0.00784767 0.00173795 -0.00219297 0.0060181 0.00606489
0.00447372 0.00103396 0.00932363 0.00230178 0.00389203 0.00151157
0.0034163 0.00821933 0.006686 0.00630778 0.00331488 0.00775066
0.00443819 0.01030204 0.00924486 0.00645933 0.00777653 0.00231206
0.00457835 0.00390425 0.00947028 0.00410065 0.00220913 0.00292507
0.00637993 0.00796807 0.00140873 0.00887537 0.00496858 0.01049942
0.00908098 0.00332722 0.00799242 0.00228494 0.00463879 0.00213429
0.00729388 0.01049232 0.00790522 0.01269361 -0.00425893 0.00256333
0.00859573 0.00472835 0.00077197 0.00191873 0.01546788 0.0014475
0.00888193 0.00648022 0.00115797 0.00351191 0.00580138 0.00614035
0.00632426 0.00408354 0.00346044 -0.00034332 0.00599384 0.00302595
0.00657633 0.01086903 0.00625807 0.00096565 0.00061804 0.00038511
0.00523874 0.00633043 0.00379965 0.00302553 -0.00123322 0.00153473
0.00725579 0.00836438 0.01295918 0.00737873]
笔记。 使用 XGBoost 1.0.0 和 1.1.0 运行脚本会产生与 1.2.0 相同的输出。
开发版本的输出 (c5645180a6afb9d3d771165e681985fe3522adf6)
1.3.0-SNAPSHOT
[ 0.00698666 -0.00211278 0.00180034 -0.00016027 0.00526194 0.00801962
0.00016758 0.00226211 0.00276773 0.00408198 0.00303223 0.00291933
0.01101091 0.00683288 0.00145871 0.00326988 0.00572827 0.01019943
0.00074329 0.00784767 0.00173803 -0.00219286 0.00601804 0.00606472
0.00447388 0.00103391 0.00932358 0.00230171 0.003892 0.00151177
0.00341637 0.00821943 0.00668607 0.00630774 0.00331502 0.00775074
0.0044381 0.01030211 0.00924495 0.00645958 0.00777672 0.00231205
0.00457842 0.00390424 0.00947046 0.00410091 0.0022092 0.00292498
0.00638005 0.00796804 0.00140869 0.00887531 0.00496863 0.01049942
0.00908096 0.00332738 0.00799218 0.00228496 0.004639 0.00213413
0.00729368 0.01049243 0.00790528 0.01269368 -0.00425872 0.00256319
0.00859569 0.00472848 0.0007721 0.00191874 0.01546813 0.00144742
0.00888212 0.00648021 0.00115819 0.00351191 0.00580168 0.00614044
0.00632418 0.0040833 0.00346038 -0.00034315 0.00599405 0.00302578
0.0065765 0.01086897 0.00625799 0.00096572 0.00061766 0.00038494
0.00523901 0.00633054 0.00379964 0.00302567 -0.00123339 0.00153471
0.00725584 0.00836433 0.01295913 0.00737863]
@hcho3你想研究一下吗? 如果需要,我可以帮助平分。
trivialfis
于 2020-11-12
等一下,我忘了在我的复制品中设置随机种子。 傻我。
hcho3
于 2020-11-12
我用固定的随机种子更新了我的再现。 该错误仍然存在。 我尝试使用 XGBoost 1.0.0 和 1.1.0 运行更新的 repro,并且预测与 XGBoost 1.2.0 的预测一致。
简而言之:
Prediction from 1.0.0
== Prediction from 1.1.0
== Prediction from 1.2.0
!= Prediction from latest master
@trivialfis是的,您的帮助将不胜感激。
hcho3
于 2020-11-12
将此标记为阻塞。
hcho3
于 2020-11-12
知道了。
trivialfis
于 2020-11-12
追溯到 a4ce0eae43f7e0e2f91566ef2360830b86b9fdcf 。 @ShvetsKS你想看看吗?
trivialfis
于 2020-11-12
追溯到a4ce0ea 。 @ShvetsKS你想看看吗?
当然。 您能否帮助从 python 复制器训练模型:
m2.load_model('xgb.model.bin') # load data
使用什么 XGBoost 版本进行训练,应该准确提供哪些参数?
 ShvetsKS
于 2020-11-12
ShvetsKS
于 2020-11-12
@ShvetsKS您可以从https://github.com/7starsea/xgboost-testing获取模型文件xgb.model.bin 。 该模型使用 1.0.0 进行训练。
hcho3
于 2020-11-12
@ShvetsKS您可以从https://github.com/7starsea/xgboost-testing获取模型文件
xgb.model.bin。 该模型使用 1.0.0 进行训练。
该模型实际上是用 1.2.1 和参数训练的
param = {'max_depth': 8, 'eta': 0.1, 'min_child_weight': 2, 'gamma': 1e-8, 'subsample': 0.6, 'nthread': 4}
谢谢。
7starsea
于 2020-11-12
似乎微小的差异是由于浮点运算的顺序发生了变化。
_确切原因:_
在 a4ce0ea 之前,我们将所有树的响应psum局部变量out_preds增加适当的值。
在 a4ce0ea 中,我们通过每个树响应直接增加out_preds值。
修复准备: https :
@7starsea感谢您找到不同之处,您能检查一下上面的修复吗?
@hcho3 , @trivialfis我们是否认为这种差异在未来很重要? 似乎这是一个重大限制,不允许更改推理的浮点运算顺序。 但是对于训练阶段,我记得没有这样的要求。
ShvetsKS
于 2020-11-12
我们是否认为这种差异在未来至关重要?
通常没有。 让我看看你的变化。 ;-)
trivialfis
于 2020-11-12
@ShvetsKS我刚刚检查过,现在差异完全为零。 感谢您修复预测差异。
7starsea
于 2020-11-12
@ShvetsKS
我们是否认为这种差异在未来至关重要? 似乎这是一个重大限制,不允许更改推理的浮点运算顺序
事实上,我们( @RAMitchell 、 @trivialfis和我)在这里同意你的看法。 强制要求准确的预测可重复性将严重阻碍我们做出改变的能力。 浮点运算是出了名的非结合运算,因此数字列表的总和会根据加法顺序略有不同。
我运行了一个实验来量化 XGBoost 1.2.0 和最新的master分支之间的预测变化: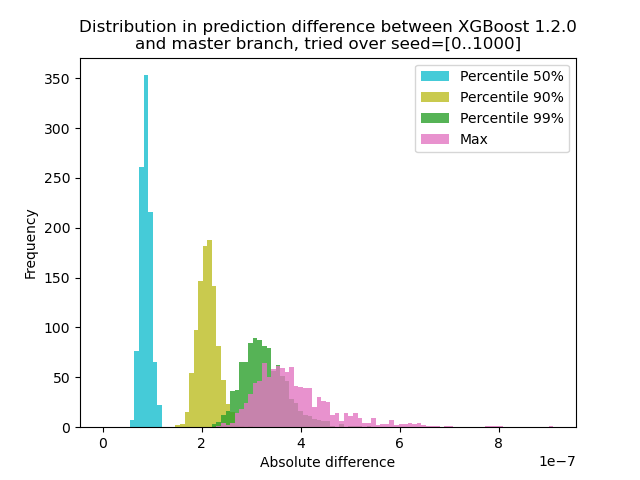
我使用 1000 个不同的随机种子生成数据,然后使用 1.2.0 和 master 版本对 1000 个矩阵进行预测。 种子之间的预测变化略有变化,但差异永远不会超过 9.2e-7,因此预测变化很可能是由浮点运算引起的,而不是逻辑错误。
实验脚本
**test.py**:生成 1000 个具有不同随机种子的矩阵并为它们运行预测。
import numpy as np
import xgboost as xgb
import argparse

def main(args):
    m2 = xgb.Booster({'nthread': '4'})  # init model
    m2.load_model('xgb.model.bin')  # load data
    out = {}
    for seed in range(1000):
        rng = np.random.default_rng(seed=seed)
        rx = rng.standard_normal(size=(100, 127 + 7 + 1))
        rx = rx.astype(np.float32, order='C')
        dtest = xgb.DMatrix(rx, missing=0.0)
        out[str(seed)] = m2.predict(dtest)
    np.savez(args.out_pred, **out)

if __name__ == '__main__':
    parser = argparse.ArgumentParser()
    parser.add_argument('--out-pred', type=str, required=True)
    args = parser.parse_args()
    main(args)
import numpy as np
import matplotlib.pyplot as plt

xgb120 = np.load('xgb120.npz')
xgblatest = np.load('xgblatest.npz')

percentile_pts = [50, 90, 99]

colors = ['tab:cyan', 'tab:olive', 'tab:green', 'tab:pink']

percentile = {}
for x in percentile_pts:
    percentile[x] = []
percentile['max'] = []

for seed in range(1000):
    diff = np.abs(xgb120[str(seed)] - xgblatest[str(seed)])
    t = np.percentile(diff, percentile_pts)
    for x, y in zip(percentile_pts, t):
        percentile[x].append(y)
    percentile['max'].append(np.max(diff))

bins = np.linspace(0, np.max(percentile['max']), 100)
idx = 0
for x in percentile_pts:
    plt.hist(percentile[x], label=f'Percentile {x}%', bins=bins, alpha=0.8, color=colors[idx])
    idx += 1
plt.hist(percentile['max'], label='Max', bins=bins, alpha=0.8, color=colors[idx])
plt.legend(loc='best')
plt.title('Distribution in prediction difference between XGBoost 1.2.0\nand master branch, tried over seed=[0..1000]')
plt.xlabel('Absolute difference')
plt.ylabel('Frequency')
plt.savefig('foobar.png', dpi=100)
由于这里的问题是带有浮点数的+没有形成一个组,我们可以在删除 sum 的情况下进行测试:在单个树上预测。 结果应该完全一样。
trivialfis
于 2020-11-13
@trivialfis事实上,当我将ntree_limit=1参数添加到m2.predict() ,差异消失为 0。
hcho3
于 2020-11-13
伟大的! 所以接下来的事情是我们如何记录它或者我们是否应该记录它。
trivialfis
于 2020-11-13
让我睡在上面。 现在,可以说这个问题并不是真正的错误。
hcho3
于 2020-11-13
相关问题
 choushishi
·
3评论
choushishi
·
3评论
 FabHan
·
4评论
trivialfis
·
3评论
FabHan
·
4评论
trivialfis
·
3评论
 pplonski
·
3评论
pplonski
·
3评论
 tqchen
·
4评论
tqchen
·
4评论
最有用的评论
@ShvetsKS
事实上,我们( @RAMitchell 、 @trivialfis和我)在这里同意你的看法。 强制要求准确的预测可重复性将严重阻碍我们做出改变的能力。 浮点运算是出了名的非结合运算,因此数字列表的总和会根据加法顺序略有不同。
我运行了一个实验来量化 XGBoost 1.2.0 和最新的

master分支之间的预测变化:我使用 1000 个不同的随机种子生成数据,然后使用 1.2.0 和 master 版本对 1000 个矩阵进行预测。 种子之间的预测变化略有变化,但差异永远不会超过 9.2e-7,因此预测变化很可能是由浮点运算引起的,而不是逻辑错误。
实验脚本
**test.py**:生成 1000 个具有不同随机种子的矩阵并为它们运行预测。
命令:`python test.py --out-pred [out.npz]`。 确保您的 Python 环境具有正确版本的 XGBoost。 让我们假设 `xgb120.npz` 存储 XGBoost 1.2.0 的结果,而 `xgblatest.npz` 存储最新 master 的结果。 **compare.py**:制作预测差异的直方图